00
Open one claim. Read the file behind it.
These eight buttons are not labels. Each one opens a file: the number, where it came from, and what it is not allowed to mean. Click another to replace the file. Click the same one to close it.
USD 518 trillion is a sum, then a rounding
UBS Global Wealth Report 2026, published in Zurich on 30 June 2026, describes personal wealth at the end of 2025 in 56 markets. UBS estimates those markets cover more than 92 percent of the world’s wealth. The pyramid has four bands: above one million dollars, 250.59 trillion; from 100,000 to one million, 200.72 trillion; from 10,000 to 100,000, 63.16 trillion; below 10,000, 3.22 trillion. Added, that is 517.69 trillion. Sentences on this desk say about 518. The calculator uses 517.69.
When this desk says global, it means that sample, unless the sentence is about an IMF world total or a World Bank poverty count. UBS says some methods changed in this edition, so a figure from an older Global Wealth Report is not always comparable. The 518 is a stock of net worth: financial assets, plus housing and land, minus debt. It is not income, and it is not gross domestic product.
10.8 percent was a wealth year, not an output year
UBS puts the rise in total personal wealth during 2025 at 10.8 percent in dollars, after 4.6 percent in 2024 and 4.2 percent in 2023, and calls it the fastest year since 2017. The IMF’s real growth for the world in that same year was 3.5 percent. The gap is asset prices and a cheaper dollar, not a year in which output suddenly ran three times faster. In dollars, Europe, the Middle East and Africa gained 17.5 percent, the Americas 8.5 percent, and Asia-Pacific 5.9 percent.
Inside those blocs, average wealth per adult rose almost 17 percent in Western Europe and 28 percent in Eastern Europe, against 8.8 percent in North America, about 4.6 percent in Greater China, and 1.6 percent in Southeast Asia. UBS says the regional gap partly reflects a cheaper dollar, which inflates wealth booked outside the United States when it is translated into dollars. Repeating 10.8 percent for ten years is a caution on the Paths page, near USD 1,444 trillion. A hot year is not a decade.
The stock did not move house in 2025
The Americas hold 40.6 percent of sample wealth, Asia-Pacific 32.8 percent, and EMEA 26.6 percent. North America alone is 38.1 percent. Western Europe is 21.9 percent. Greater China is 18.5 percent, a little less than the year before. Southeast Asia is 11.5 percent. Eastern Europe is 3.3 percent. Australia and New Zealand are 2.8 percent. Latin America is 2.5 percent. The Middle East and South Africa, grouped together in the report, are 1.4 percent. The United States by itself is 35.7 percent.
The United States and Greater China together still hold more than half of the personal wealth in the sample. A small share can be a high average: Australia and New Zealand are 2.8 percent of the stock and almost USD 589,000 per adult. A large population can still be a modest average. This desk does not file India, Japan, or Korea into the 11.5 percent Southeast Asia line. The report discusses those countries on their own.
The average and the middle told different years
Average wealth per adult in the United States is USD 696,277. Switzerland leads the country table at USD 910,382, then falls to eighth once the measure is the median. The United States is second on the average and 28th on the median. In 2025, UBS reports that average wealth rose notably while median wealth declined in most markets. Since 2020, in real local-currency terms, fewer than half the markets have a higher median than at the start of the decade.
Japan’s real median is up more than 50 percent. The United Arab Emirates is above 40 percent. India, Thailand and Cyprus are near 20 percent. South Korea’s real average is up more than 55 percent, while its median is up a little over 12 percent. Real average wealth per adult is down 23.2 percent in the United Kingdom, 14.4 percent in the Netherlands, 4.5 percent in France, and 3.1 percent in Brazil. Italy is roughly flat. Britain still added more than 43,000 dollar millionaires in 2025. The top is not the middle.
41 percent is a wealth band. 831 million is a poverty count.
Just over 41 percent of adults in the UBS sample still have less than USD 10,000 of net worth: 1.62 billion adults holding USD 3.22 trillion, 0.6 percent of the wealth. In 2000 that floor held almost 75 percent of adults. The 2025 edition said the floor had ceased to be the largest band. On the 2026 pyramid it is slightly ahead again, 42.1 percent of adults against 41.1 percent in the band from 10,000 to 100,000. Together those two bands are more than four fifths of adults and less than 13 percent of the wealth.
That is not the World Bank’s fall 2025 poverty update. That update counted about 831 million people below USD 3 a day, down from about 2.3 billion in 1990, and about 3.7 billion below USD 8.30 a day. Since 2022 most people in extreme poverty have lived in fragile and conflict-affected states, and about three quarters are rural. A later World Bank page has cited a count near 837 million. This desk uses the fall 2025 update and does not average the two. Wealth bands count adults and balance sheets. Poverty lines count people and consumption.
The IMF table stops in 2031
The October 2026 World Economic Outlook, using information through 1 October 2026, has world real growth at 3.5 percent in 2025, 3.1 percent in 2026, 3.4 percent in 2027, and 3.1 percent in 2031. Advanced economies as a group are 1.5 percent by 2031. The United States is 2.3 percent in 2026 and 2027, and 1.8 percent in 2031. The euro area stays near 1.1 percent. China goes from 5.0 percent in 2025 to 4.5, then 4.0, then 3.3 in 2031. India is 7.8 percent in 2025, 7.0 in 2026, 7.0 in 2027, and 6.8 in 2031. Indonesia stays near 5.1 through 2027 and 5.2 in 2031. Japan is 0.7, 0.7, then 0.6. Brazil is 2.2 percent in 2026 and 2.5 percent in 2031. Sub-Saharan Africa is 4.5 percent in 2026 and 4.7 percent in 2031.
Nominal world output at market exchange rates goes from USD 118.485 trillion in 2025 to USD 128.0 trillion in 2026 and USD 161.725 trillion in 2031. Headline inflation is projected at 4.7 percent in 2026 and 4.1 percent in 2027. Middle East and Central Asia is projected to contract 0.3 percent in 2026 and rebound 6.3 percent in 2027 if the conflict does not escalate and energy markets normalize. Ten years from the end of 2025 lands at the end of 2035. A story that says 2036 is one year longer than that, and the last years are outside the published table. Income growth is not a wealth total.
The same percentage can be five different decades
Financial assets as a share of personal wealth, in the UBS tables: Sweden 83.6 percent, and the debt cell for Sweden is left blank here because the report does not give this desk a figure to print. Norway’s debt is above a quarter of gross wealth, stated separately. The United States is 78.9 percent financial and 10.9 percent debt. Israel is 82.1 percent financial; this desk does not invent an Israeli debt ratio. Taiwan is 80.8 and 11.9. South Africa is 79.5 and 14.0. Brazil is 73.3 and 23.4. Hong Kong is 69.3 and 7.4. Japan is 68.9 and 11.9. Canada is 66.2 percent financial; the rest of that row is not invented.
Switzerland is 65.3 and 20.5. Singapore is 63.8 and 11.8. The United Arab Emirates is 59.2 and 6.0. Saudi Arabia is 58.6 and 5.9. The United Kingdom is 55.9 and 20.0. Korea is 54.9 and 11.3. Mainland China is 51.9 and 10.6. Italy is 50.9 percent financial. France is 46.9. Australia is 46.6 and 18.0. Mexico is 44.3 and 5.2. Germany is 43.6 and 11.0. Spain is 31.4 percent financial. Russia is 31.2 and 8.0. India is 25.8 and 8.2. A decade that reprices shares does not feel like a decade that reprices apartments. Household debt grew in 2025 at the fastest pace since 2017, after shrinking in 2024.
The blanks are part of the reading
This desk does not print a single wealth total for 2036. Ten years of arithmetic from the end of 2025 lands at the end of 2035, and only if you choose a rate. UBS names the great wealth transfer and rising female wealth ownership. In the passages used here it does not give one global dollar total for either, so this desk does not supply one. Sweden’s financial share is 83.6 percent. Sweden’s debt ratio is not borrowed from Norway. India, Japan, and Korea are not filed under Southeast Asia’s 11.5 percent.
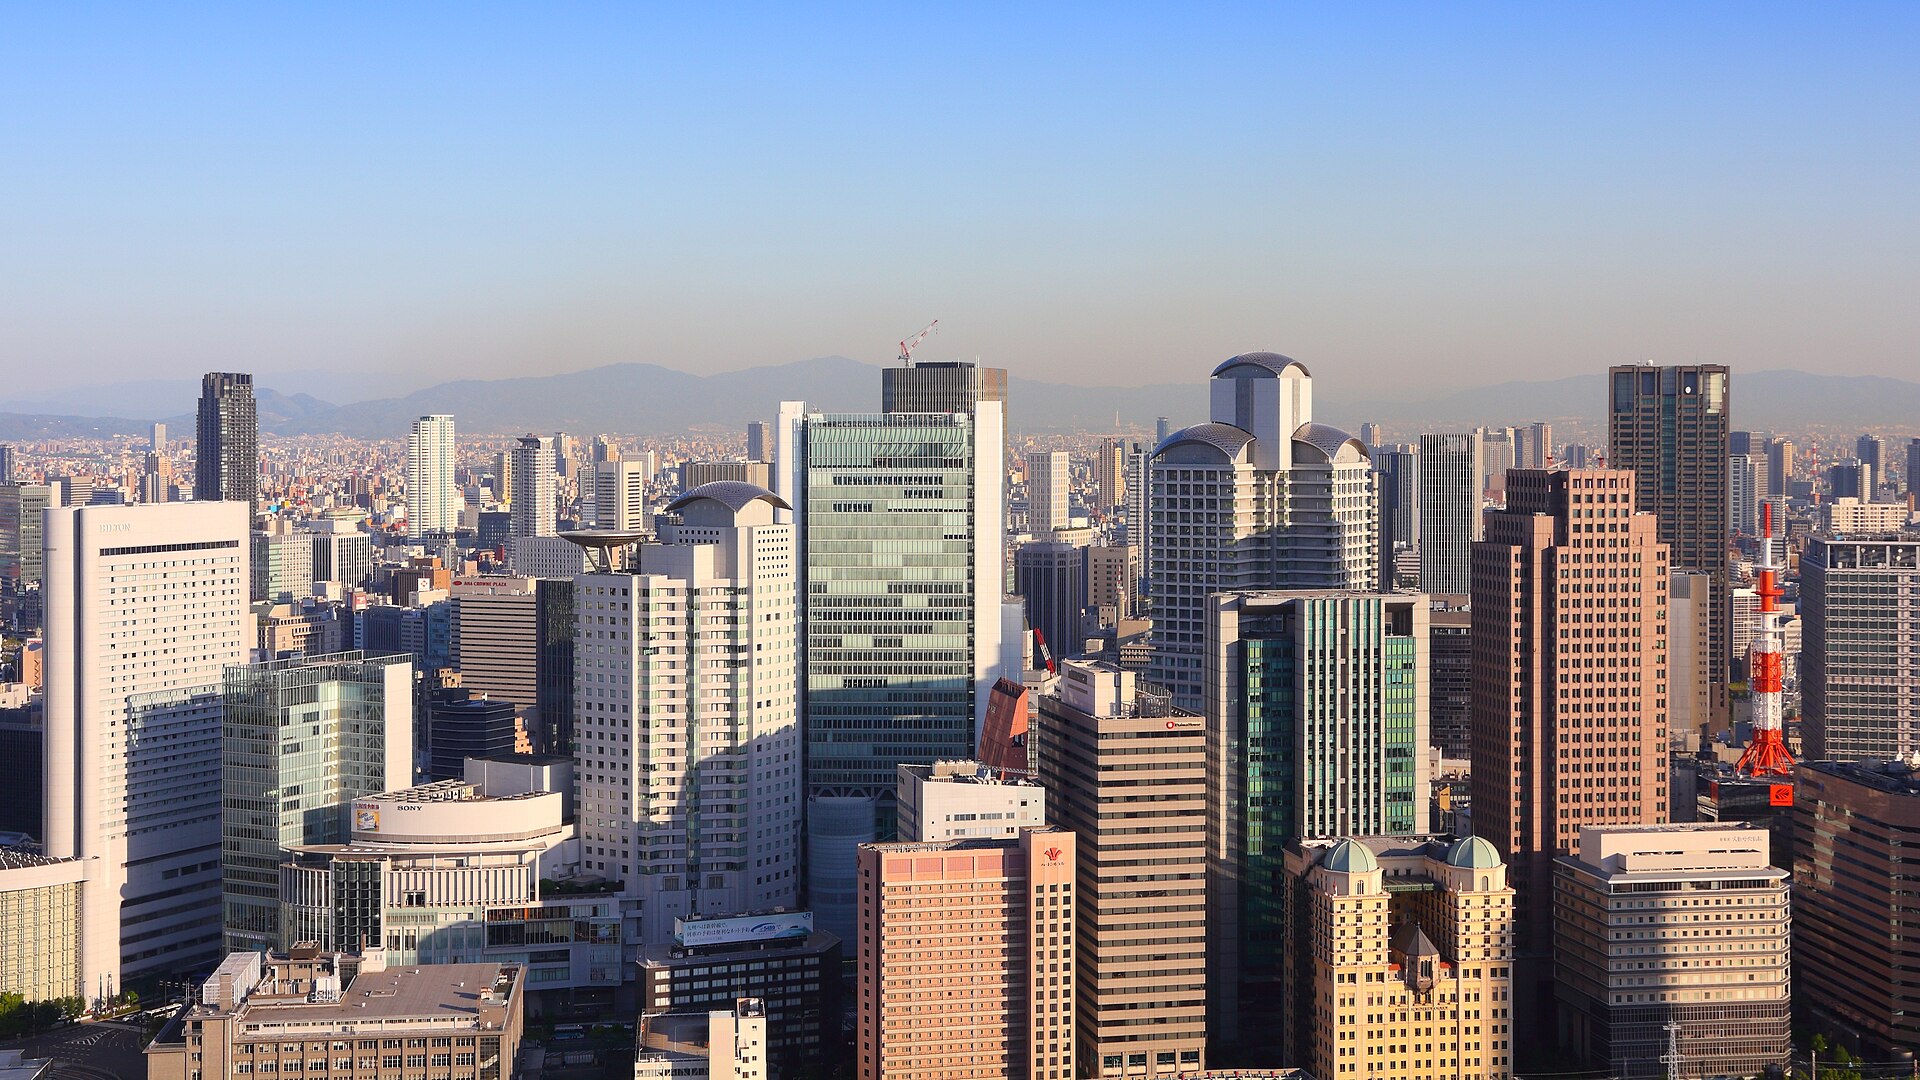
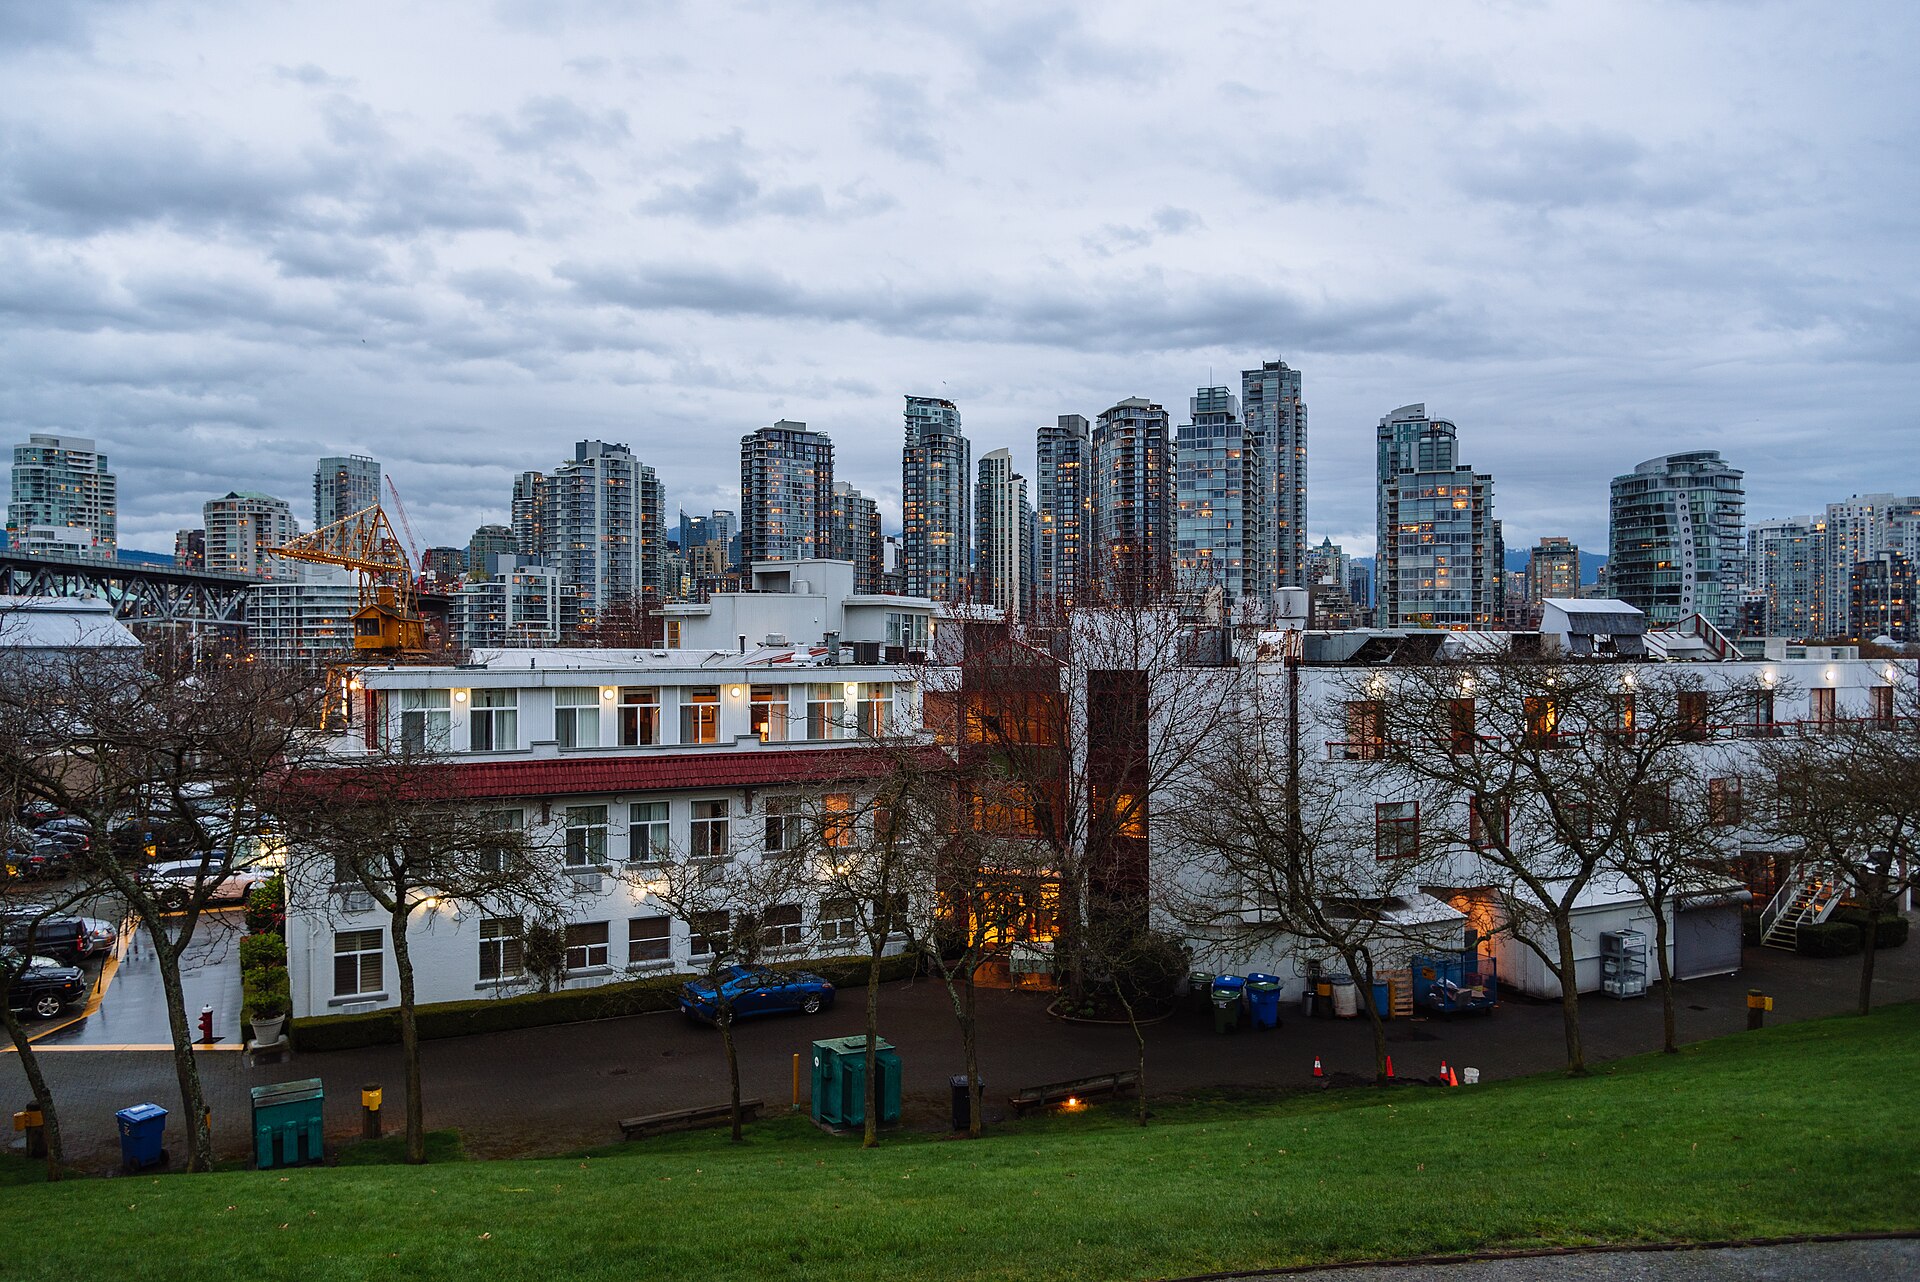
A skyline is not a statistic. The night behind these pages is the Jacksonville skyline on 17 January 2008, seen from across the St. Johns River. The moving picture in the frame above is the Boulevard of Sabana Grande in Caracas on 17 May 2018. Neither file is a net-worth band. The press note puts North America near USD 660,000 per adult. The chapter text says above USD 664,000. Both sit below the United States average of 696,277, because the region is more than one country. This desk does not pick a third number to settle them.
01
A stock, not a paycheck
Wealth, on this desk, is net worth. Financial assets, plus non-financial assets such as housing and land, minus debt. It is not income, and it is not gross domestic product. A person can earn more and be no wealthier if the extra pay is spent. A person can earn the same and be much wealthier if a house or a portfolio of shares is repriced.
That is why 2025 can be a boom for wealth and only an ordinary year for output. UBS puts the rise in total personal wealth at 10.8 percent in dollar terms, after 4.6 percent in 2024 and 4.2 percent in 2023. The IMF's real growth figure for the world in 2025 is 3.5 percent. Markets and property did the rest. Non-financial wealth rose as well. UBS reads that as a broader lift in living standards, and then qualifies the sentence, because the median did not follow the average.
02
What 2025 did to the map
The dollar fell, and the map moved with it. In dollars, Europe, the Middle East and Africa gained 17.5 percent, the Americas 8.5 percent, and Asia-Pacific 5.9 percent. Inside those blocs, average wealth per adult rose almost 17 percent in Western Europe and 28 percent in Eastern Europe, against 8.8 percent in North America, about 4.6 percent in Greater China, and 1.6 percent in Southeast Asia. UBS says the regional gap partly reflects a cheaper dollar, which inflates wealth booked outside the United States when it is translated into dollars.
A dollar ranking is a photograph of the exchange rate as well as of the balance sheet.
03
The person in the middle
Average wealth per adult in the United States is USD 696,277. Switzerland leads the country table at USD 910,382, then falls to eighth once the measure is the median, the point where half of adults are above and half are below. The United States is second on the average and 28th on the median in the UBS ranking. Luxembourg is the rare name that stays near the top on the average, the median, and GDP per adult. Belgium is a median story. Italy sits behind Germany on the average and ahead of it on the median.
04
Five things only a decade can do
First, compounding. In the 2025 edition, UBS put the compound growth of total wealth since 2000 at 3.4 percent a year. Ten years at that pace, applied to an end-2025 stock of about USD 518 trillion, is arithmetic, not a forecast. The stock would be near USD 723 trillion at the end of 2035. The same sum at 2 percent ends near USD 631 trillion. At 5.3 percent, close to the pace of IMF nominal world output between 2025 and 2031, it ends near USD 868 trillion. Repeating 2025's 10.8 percent for a decade would push the stock toward USD 1,444 trillion. That last path is a caution. Hot years are not decades. The calculator on the Paths page lets you move the rate yourself.

05
Where new output is forming
The IMF's October 2026 World Economic Outlook, using information through 1 October, has the world slowing from 3.5 percent real growth in 2025 to 3.1 percent in 2026, then 3.4 percent in 2027, and 3.1 percent again in 2031. Nominal world output at market exchange rates goes from USD 118.5 trillion in 2025 to USD 128.0 trillion in 2026 and USD 161.7 trillion in 2031. Personal wealth in the UBS sample is already a little over four times that 2025 world-output figure. The ratio is only a sketch: the wealth sample is about 92 percent of wealth, and the GDP figure is the whole world.

06
Four kinds of number
A reader who treats every percentage on this desk as the same kind of fact will finish quickly and leave with the wrong decade. There are four kinds. They do not add. They do not cancel. Each one answers a question the others are not allowed to answer.
A stock
The UBS pyramid is a stock at the end of 2025. Four bands sum to USD 517.69 trillion, which this desk rounds to about 518 in sentences. The top band is USD 250.59 trillion. The next is 200.72. Then 63.16. The floor is 3.22. A stock is what is already owned, after debt. It is not this year's pay.
A flow
The IMF's 3.1 percent is a flow: real growth of world output in 2026, and again the projection for 2031. Nominal world output is a different flow, in current dollars: USD 118.485 trillion in 2025, 128.0 trillion in 2026, 161.725 trillion in 2031. A fast flow on a small base can still leave the stock where it was.
An average and a median
Switzerland's average wealth per adult is USD 910,382, first in the country table, and eighth once the measure is the median. The United States is USD 696,277, second on the average and 28th on the median. In 2025 UBS says the average rose notably while the median fell in most markets. An average can be a story about the top. A median is a story about the person in the middle.
A dollar and a local currency
2025's 10.8 percent is a dollar change in the whole stock. Southeast Asia's 1.6 percent and Eastern Europe's 28 percent are dollar changes in average wealth per adult. UBS says a weaker dollar did part of that regional work. Since 2020, the check is real and local: Korea's average above 55 percent, its median near 12; Japan's median above 50 percent; the United Kingdom's average down 23.2 percent. A dollar league table remembers the exchange rate.
Keep a fifth distinction beside those four. Real growth removes inflation. Nominal growth does not. The IMF's 3.5 percent for the world in 2025 is real. Its USD 118.485 trillion of world output is nominal, at market exchange rates. Headline inflation is projected at 4.7 percent in 2026 and 4.1 percent in 2027. A wealth table that only remembers 10.8 percent is mixing a nominal dollar stock with a real output year and calling the mixture a law.
08
Since 2020, two lists
The years since 2020 are the nearest thing this desk has to a finished decade, and they do not tell one story. UBS looks at real wealth per adult in local currency. Fewer than half of the markets have a higher median than at the start of that window. The average and the median parted company in places that a dollar headline treats as one success.
Where the middle gained
Japan's real median is up more than 50 percent. The United Arab Emirates is above 40 percent. India, Thailand and Cyprus are near 20 percent. Korea's median is up about 12 percent, which would look ordinary if the average beside it were not above 55 percent. A median gain is the sentence this desk trusts more than a skyline, because it had to survive inflation and the local currency.
Where the average fell
Real average wealth per adult is down 23.2 percent in the United Kingdom, 14.4 percent in the Netherlands, 4.5 percent in France, and 3.1 percent in Brazil. Italy is roughly flat. Britain still added more than 43,000 dollar millionaires in 2025. The millionaire line is a dollar line. The typical adult is not that line. A country can mint new millionaires while the middle loses ground.
09
The published path, place by place
The October 2026 World Economic Outlook uses information through 1 October 2026. Its statistical horizon stops in 2031. Anything said about 2032, 2033, 2034, 2035 or 2036 is not in that table. The rates below are real GDP, annual percent change. They are not wealth forecasts. A country can grow slowly and still hold a vast stock. A country can grow quickly and still hold a thin one.
World real growth in 2026, and again the projection for 2031. 2025 was 3.5 percent. 2027 is 3.4 percent. The cruising speed in the published table is near 3 percent, not near 10.8.
Advanced economies as a group in 2031. The places that already hold most of the stock are the places whose published output path is the slow one.
The United States in 2026 and in 2027. The 2031 figure is 1.8 percent. The stock underneath is 35.7 percent of sample wealth and mostly financial.
The euro area, about 1.1 percent in 2026 and again near 1.1 percent in 2031. 2027 is 1.2 percent. Western Europe's wealth share is 21.9 percent. The flow is slow. The stock is old.
China: 5.0 percent in 2025, 4.5 in 2026, 4.0 in 2027, 3.3 in 2031. The slowing is already in the table. It is not a reason to invent a wealth total for 2036.
India in 2026 and in 2027, after 7.8 percent in 2025, and 6.8 percent in 2031. The billionaire count is 211. The harder question is the median, which since 2020 is up about 20 percent in real local terms, not the tower count.
Indonesia, about 5.1 percent through 2027, and 5.2 percent in 2031. A steady path is not a regional wealth share. Do not drop Indonesia into a sentence that was written for a different line.
Japan in 2031, after 0.7 percent in 2026 and 2027. Set that beside a real median up more than 50 percent since 2020. Output and the middle of the wealth distribution are not the same chart.
Middle East and Central Asia in 2026, then 2027, if the conflict does not escalate and energy markets normalize. The rebound is conditional. The condition is part of the number.
10
What a photograph may prove
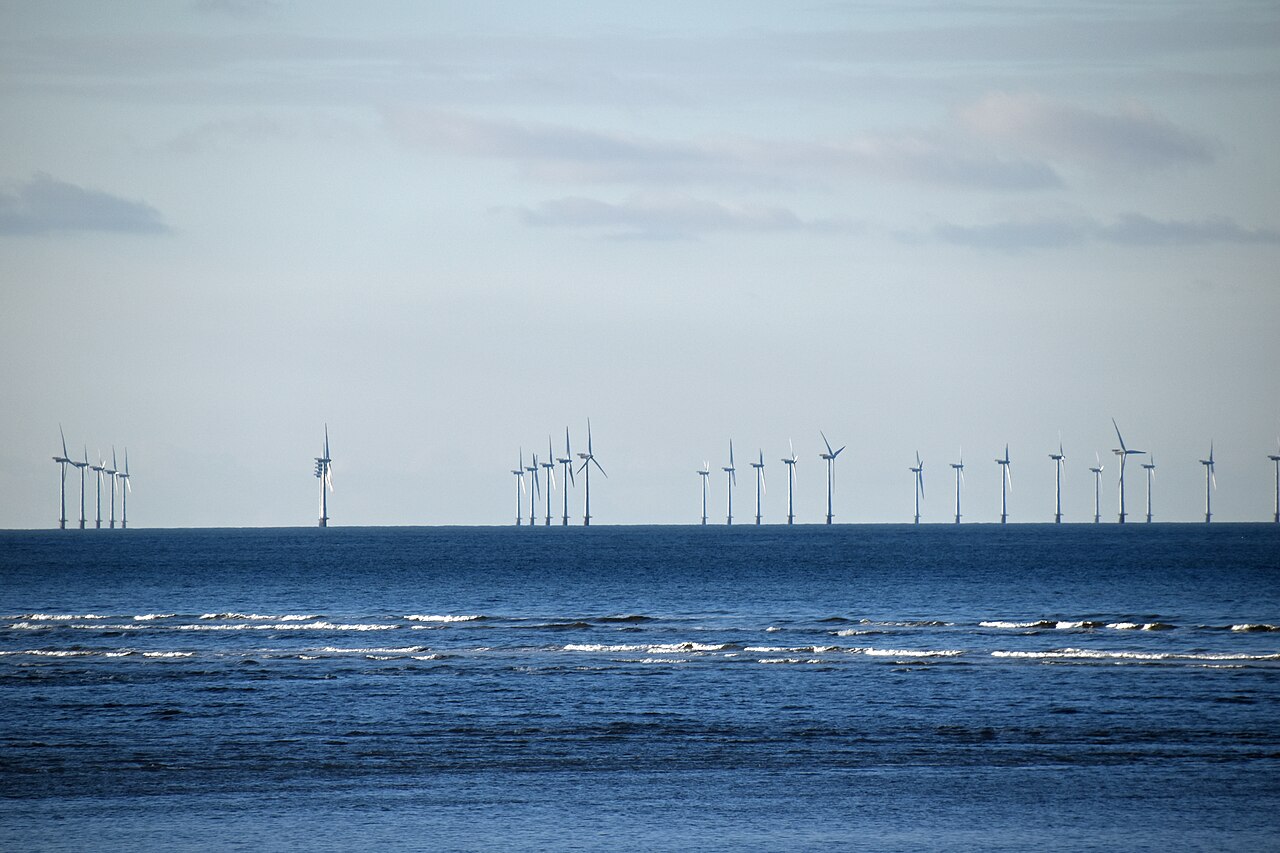
Every picture on this desk is a real photograph, dated, with a photographer and a license. The background behind these pages is the Jacksonville skyline at night on 17 January 2008, photographed by Jonathan Zander (Digon3) under CC BY-SA 3.0, from across the St. Johns River. That file is not repeated inside the pages. It is not the United States' 35.7 percent. Pudong, photographed on 20 November 2017 by King of Hearts under CC BY-SA 4.0, sits in the essay above as its own picture. It is not the 18.5 percent. A frame proves that a place looked like this when the shutter closed. It does not prove a net-worth band, a growth rate, or a forecast.
The New York Stock Exchange, 16 August, Arild Vågen. Nine years before the 35.7 percent. The columns are not the millionaires.
Taipei 101 on 5 July, Zhongcen Fanjiang. Taiwan has more than 770,000 dollar millionaires in the later count. The tower was already standing.
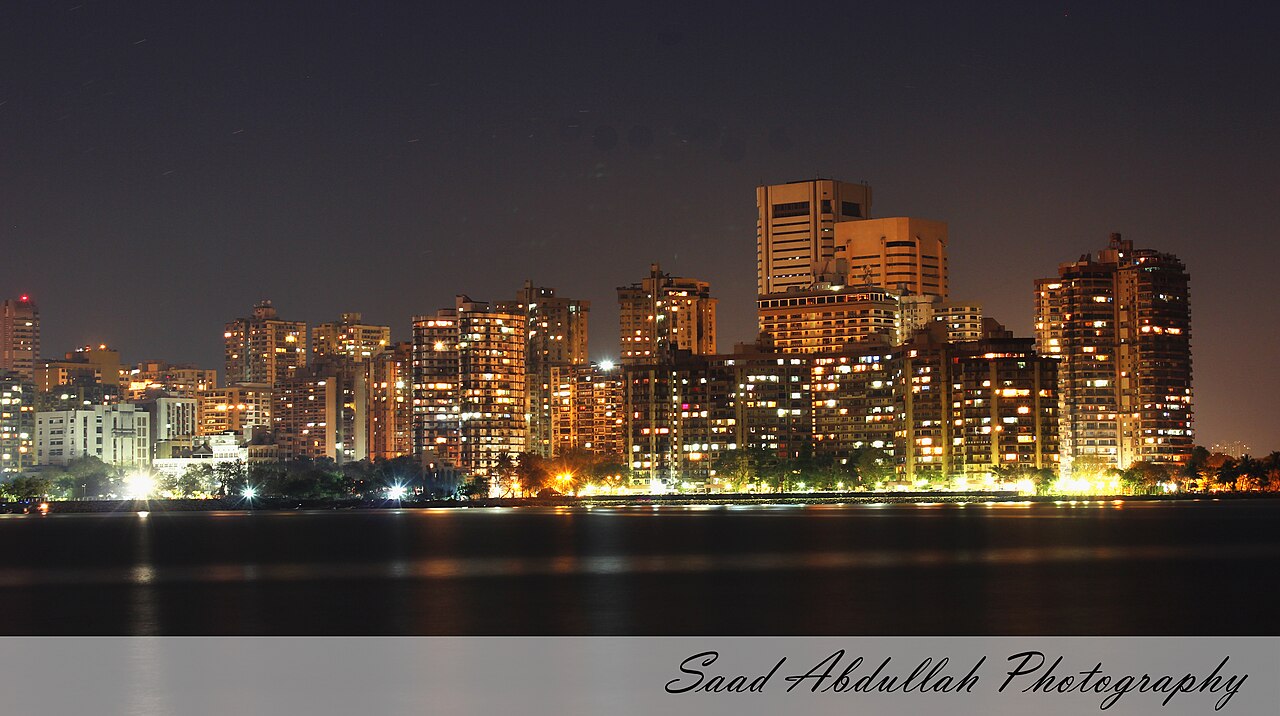
Nariman Point, 5 March, and Shibuya, 9 March. Mumbai and Tokyo in the same spring. India's median story and Japan's median story are not those afternoons.
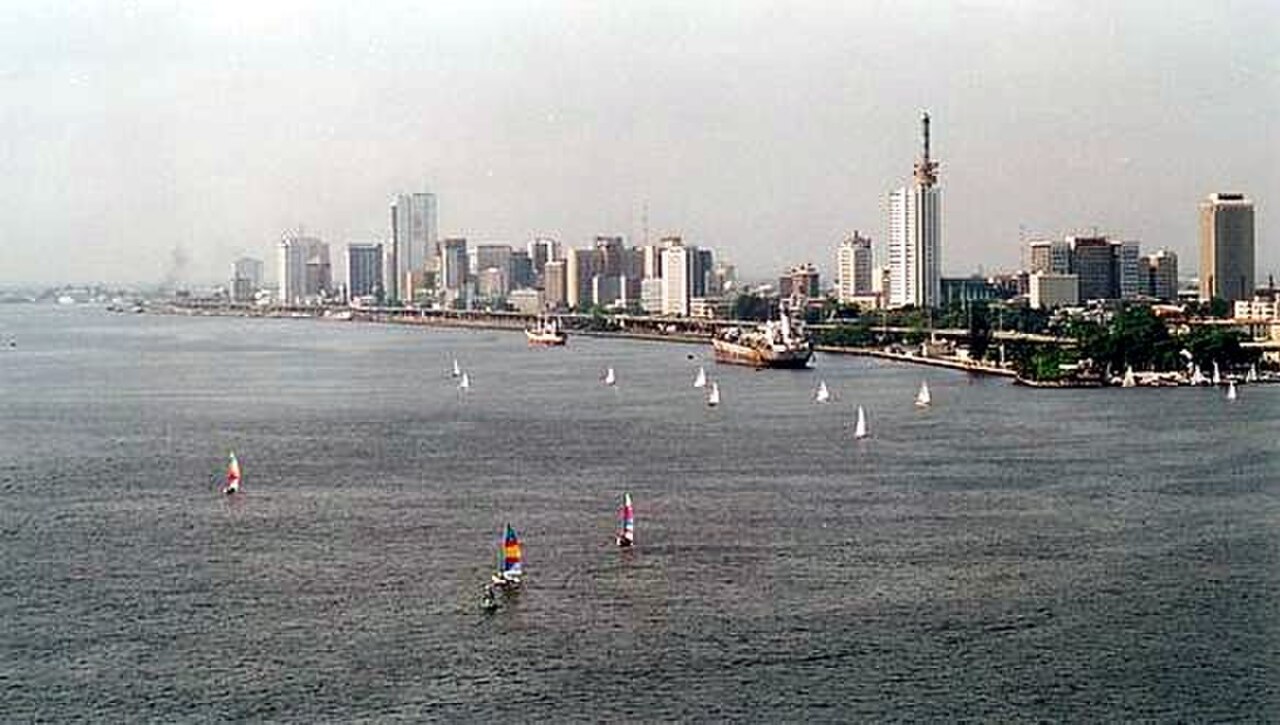
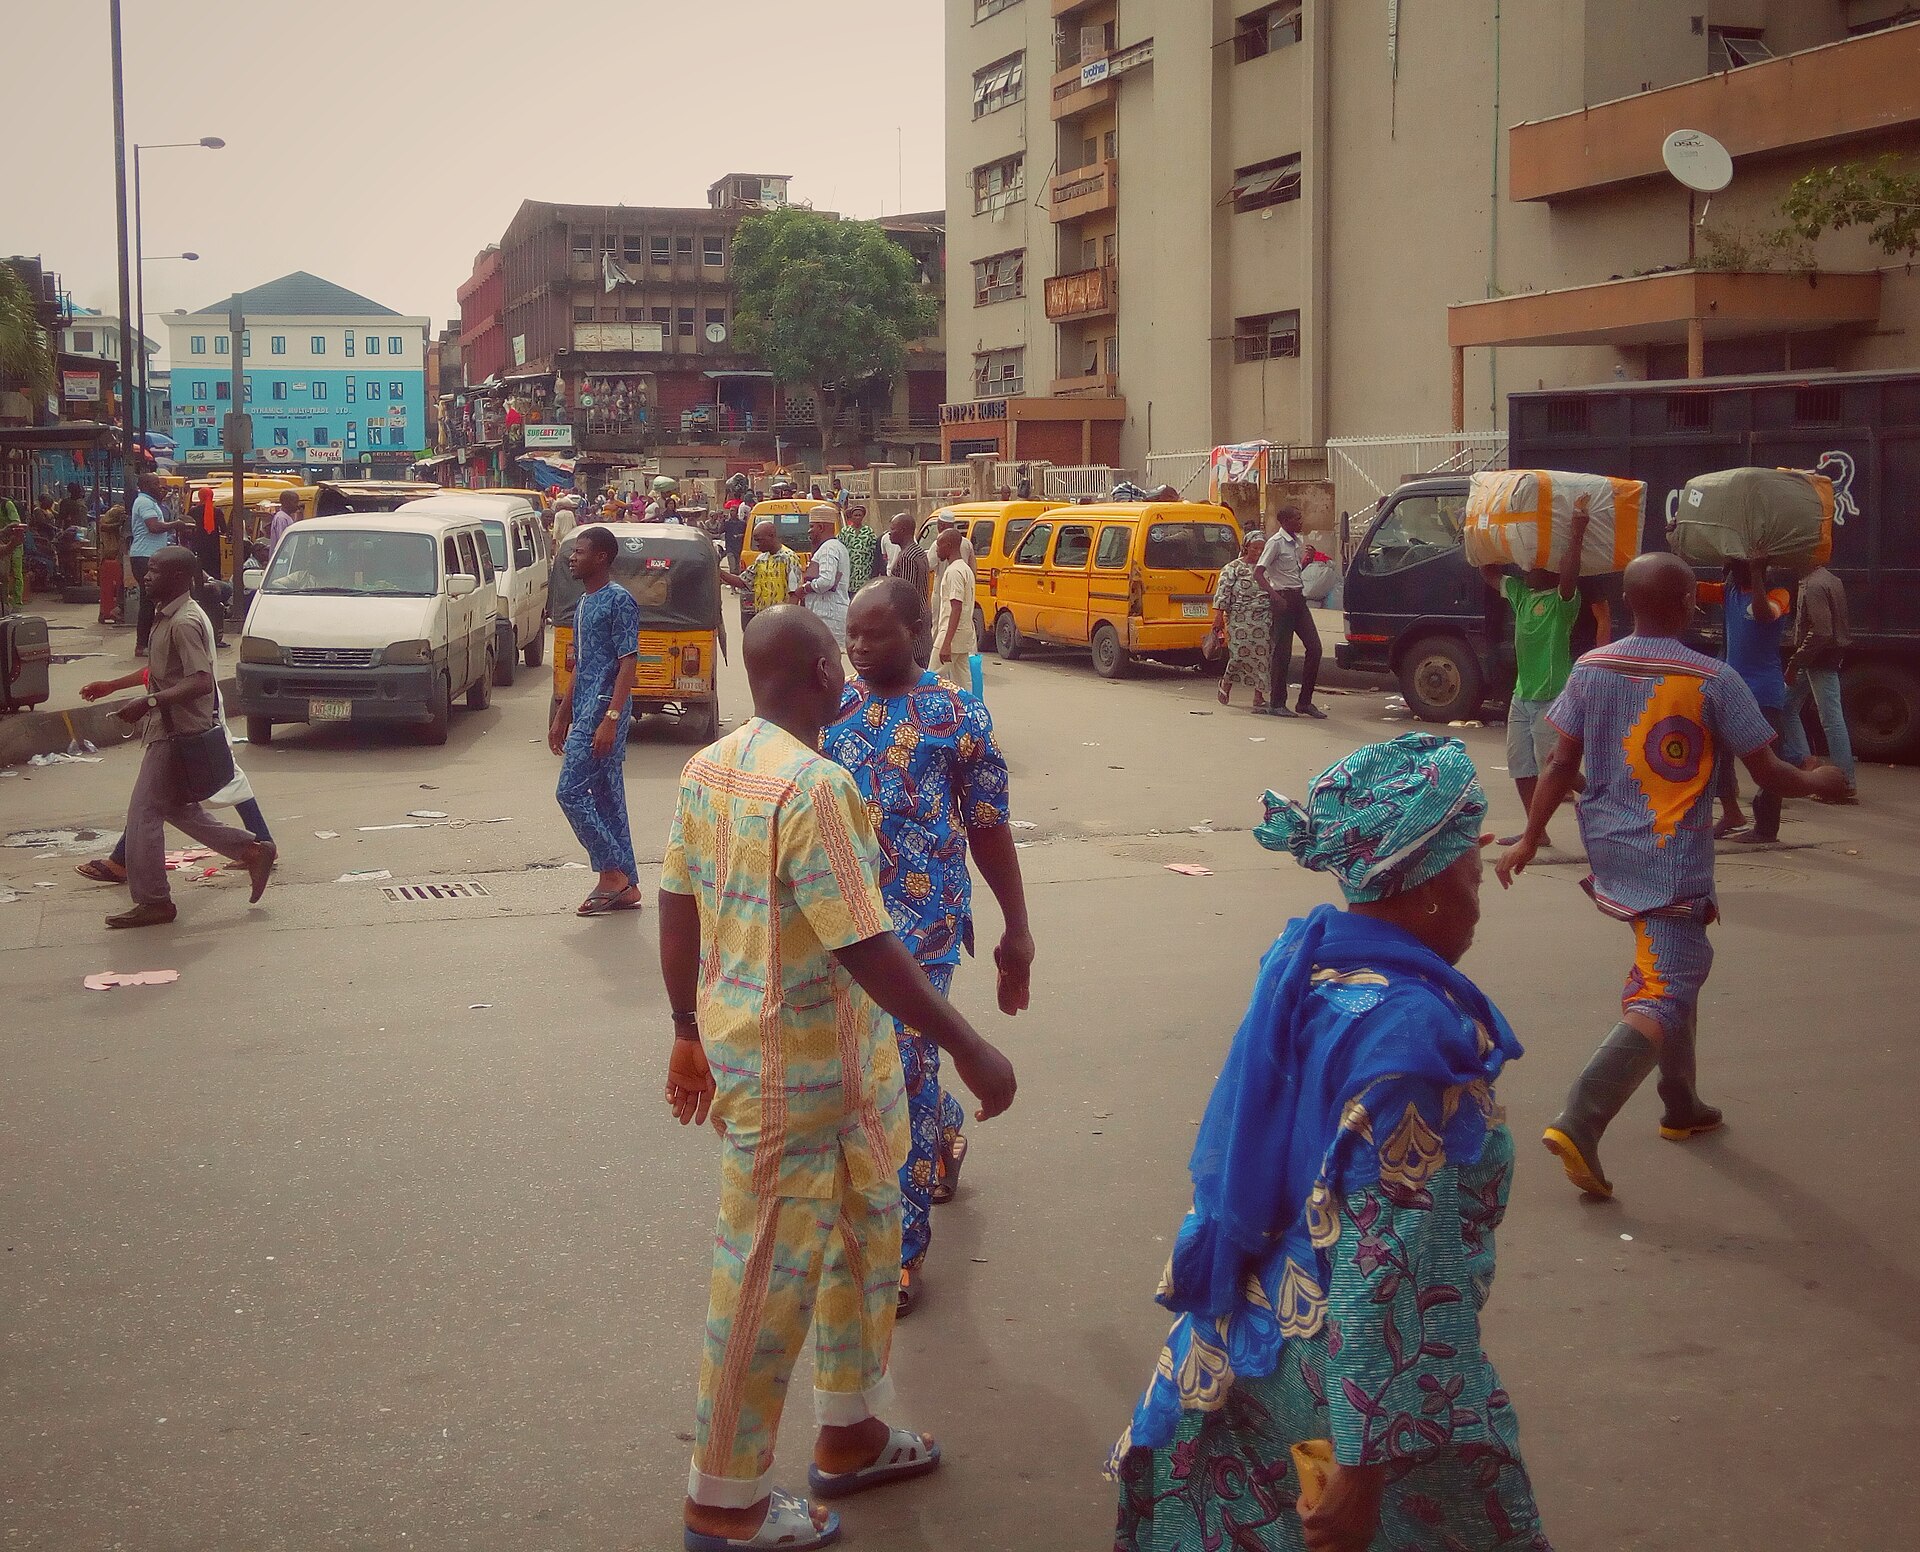
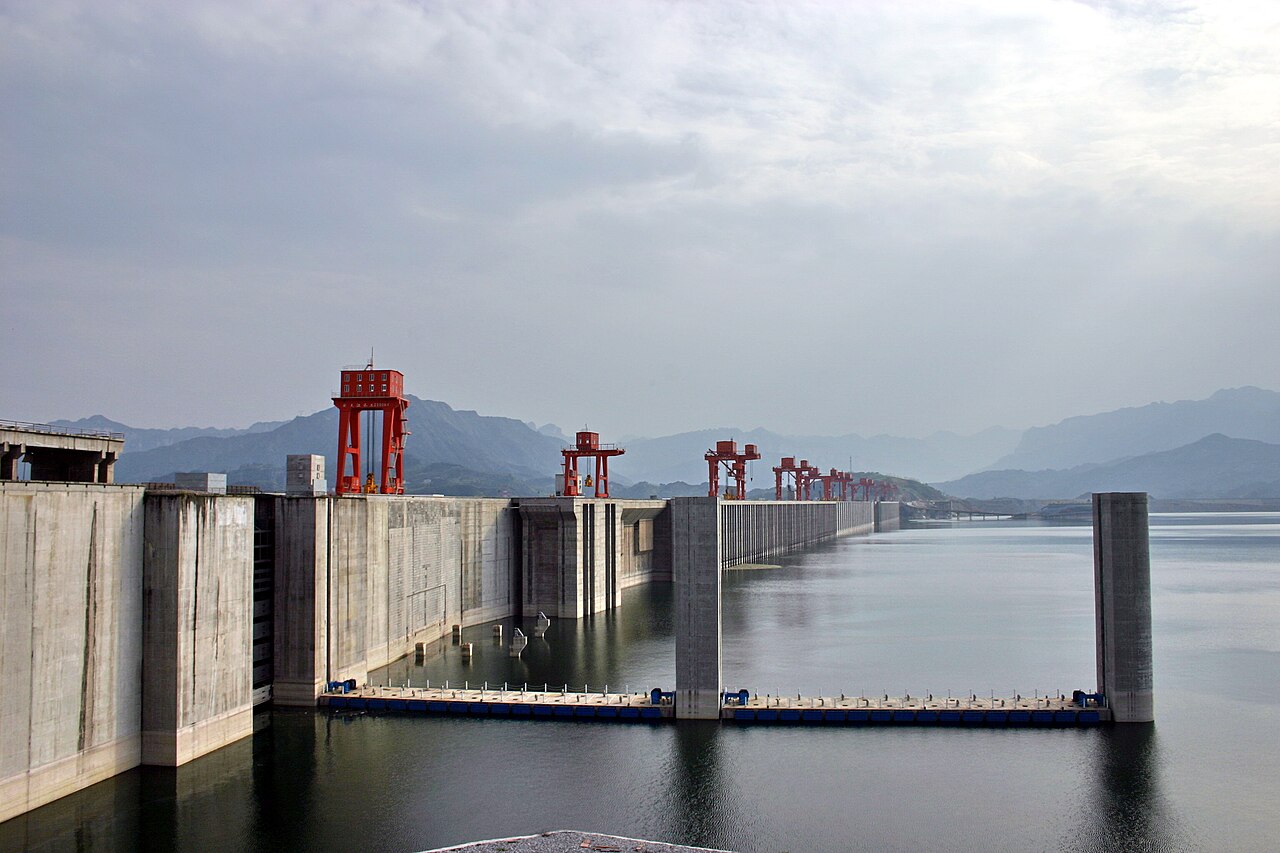
Lagos Island, Benji Robertson, and the Three Gorges Dam at Sandouping on 3 April, Dan Kamminga. The dam's nameplate is 22,500 megawatts. That is a machine size, not a wealth band.
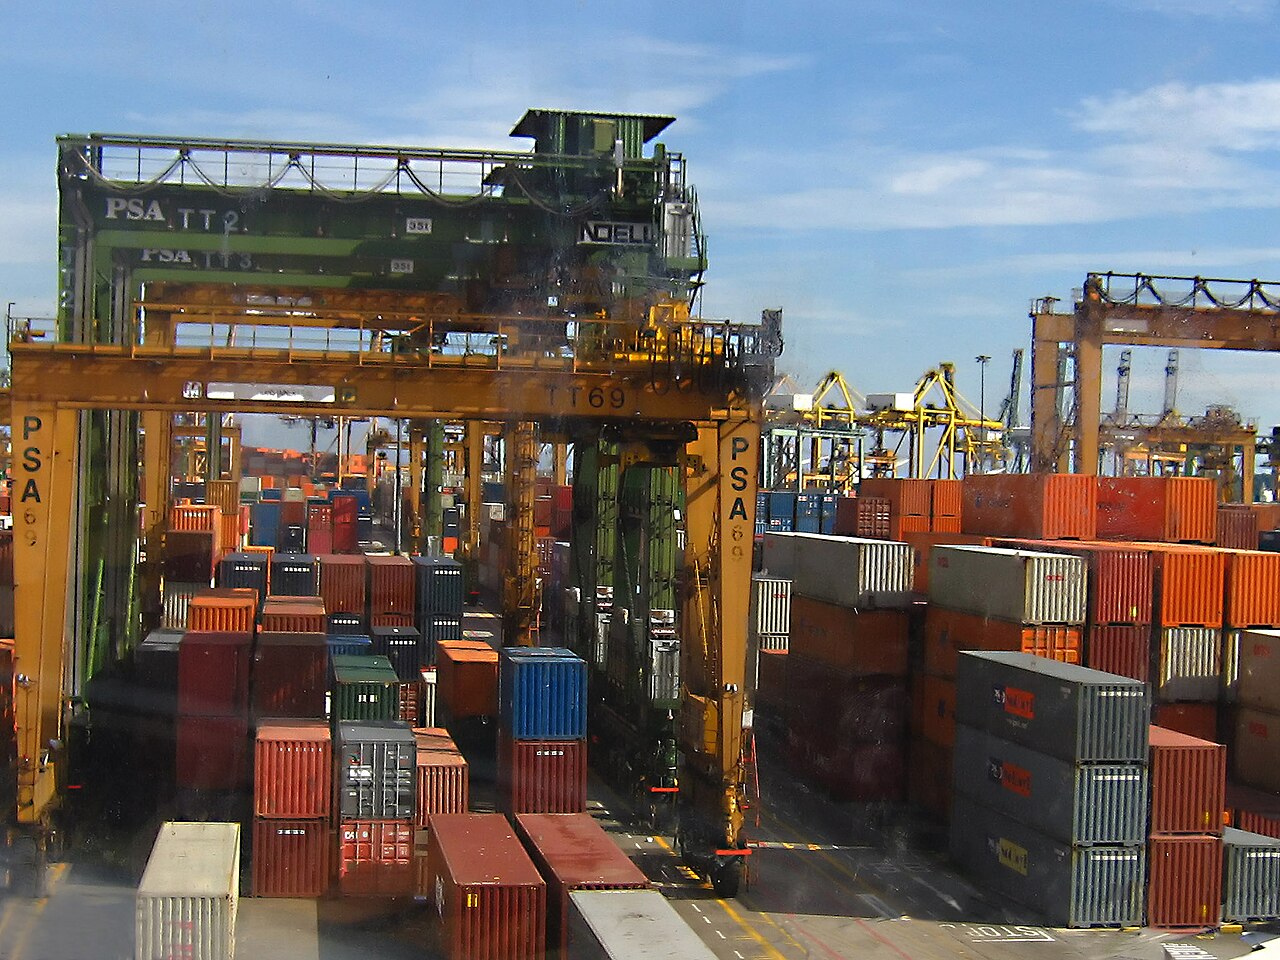
Keppel Terminal, Singapore, 7 May, Calvin Teo. A working port from twenty years ago. Southeast Asia's 11.5 percent is a 2025 stock, not a crane.
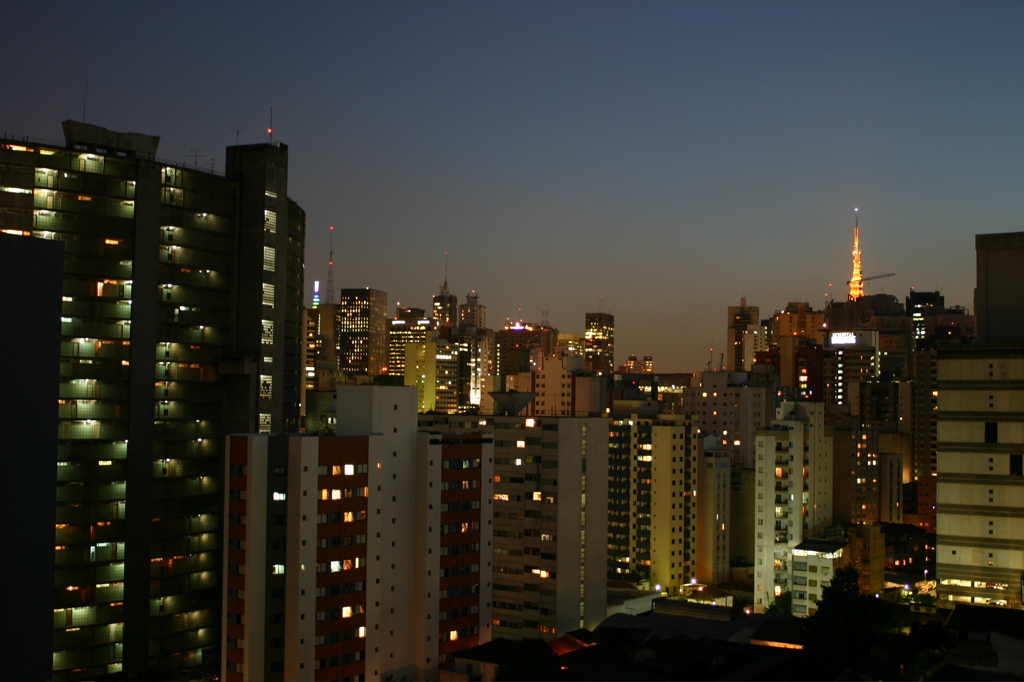
São Paulo at night, 17 August, Thomas Hobbs. Latin America's 2.5 percent and Brazil's 23.4 percent debt ratio came long after this skyline was printed.
11
The blanks this desk will not fill
A long page can still be honest about what it does not know. The blanks are part of the reading. Filling them with a round number would make the desk shorter and false.
No wealth total for 2036
Ten years from the end of 2025 lands at the end of 2035. A story that says 2036 is one year longer. The IMF table stops in 2031. The Paths dial can multiply 2 percent, 3.4 percent, 5.3 percent or 10.8 percent. Each result is arithmetic. None of them is a UBS or IMF forecast. Repeating 2025 is a caution, not a plan. Hot years are not decades.
No inheritance total
UBS names the great wealth transfer and a rise in wealth recorded in women's names. In the passages used here it does not give one global dollar total for either. Governments with more debt than in the recent past are likely, the report says, to look toward private wealth. The direction is in the source. The missing total stays missing.
No borrowed debt ratio
Sweden's financial assets are 83.6 percent of personal wealth. The debt cell in that row is blank in the material used here, so the table on the Holders page prints a dash. Norway's debt, above a quarter of gross wealth, is stated because the report states it. A neighbour's number is not a source.
No false membership
Southeast Asia at 11.5 percent is a line in the report. India, Japan and Korea are discussed on this desk with their own figures: India's growth path and median, Japan's median above 50 percent, Korea's average above 55 percent and median near 12. They are not pushed into the 11.5 percent to make a neater map.
12
2025, read without skipping
A year can be told in one percentage, and then it can be told again until the percentage has nowhere left to hide. 2025 was a 10.8 percent rise in total personal wealth in the UBS sample, measured in dollars. It followed 4.6 percent in 2024 and 4.2 percent in 2023. UBS calls it the fastest year since 2017. That sentence is true and incomplete. The same year, the IMF’s real growth for the world was 3.5 percent. Markets and property did the rest. Non-financial wealth rose as well. The median, in most markets, did not follow the average.
Start with the three big blocs, because a reader who stops at 10.8 percent will think the world moved together. It did not. In dollars, Europe, the Middle East and Africa gained 17.5 percent. The Americas gained 8.5 percent. Asia-Pacific gained 5.9 percent. The fastest bloc was not the bloc that holds the most wealth. The Americas still hold 40.6 percent of the sample. Asia-Pacific holds 32.8 percent. EMEA holds 26.6 percent. A fast year on a smaller stock does not hand the map to a new owner.
14
Four bands, read aloud
The pyramid is usually shown as a picture, and pictures are easy to leave. Read it as four rooms. The top room, above one million dollars of net worth, holds 58 million adults. The prose of the same report also says about 57.5 million millionaires. This desk prints both and does not sand them into one false exactness. Those adults are 1.5 percent of the sample. They hold USD 250.59 trillion, which is 48.4 percent of the wealth. North America and Western Europe hold more than 70 percent of the millionaires. North America and Greater China hold more than 56 percent. The United States alone has more than 23.6 million of them.
15
The west of the stock
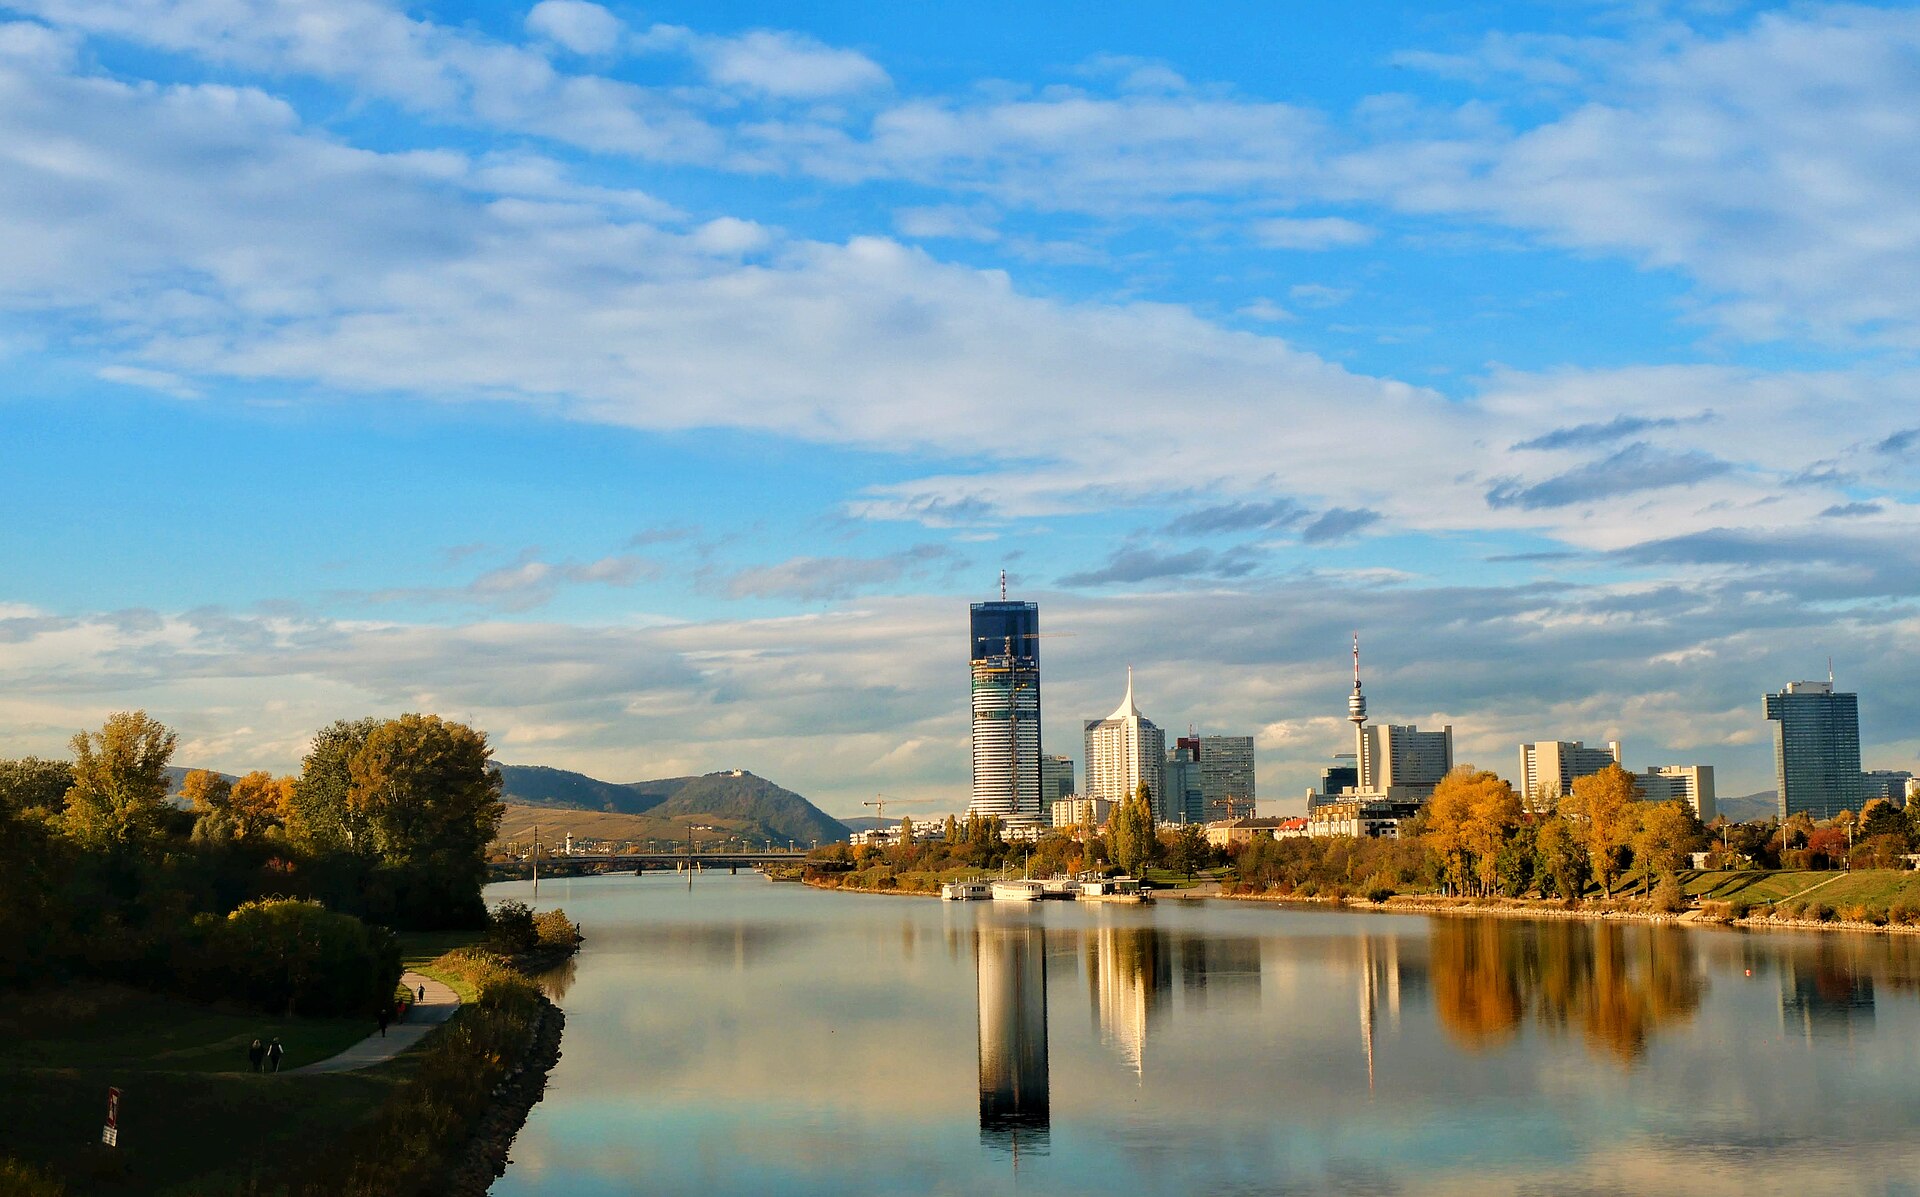
North America is 38.1 percent of sample wealth. The United States alone is 35.7 percent. The press note puts North America near USD 660,000 of average wealth per adult. The chapter text says above USD 664,000. The United States figure is USD 696,277. Both regional readings sit below the country figure because the region is more than one country. Canada’s financial share is 66.2 percent. This desk does not invent the rest of Canada’s row. The gap between the press sentence and the chapter sentence is left as a gap.

16
The east of the stock
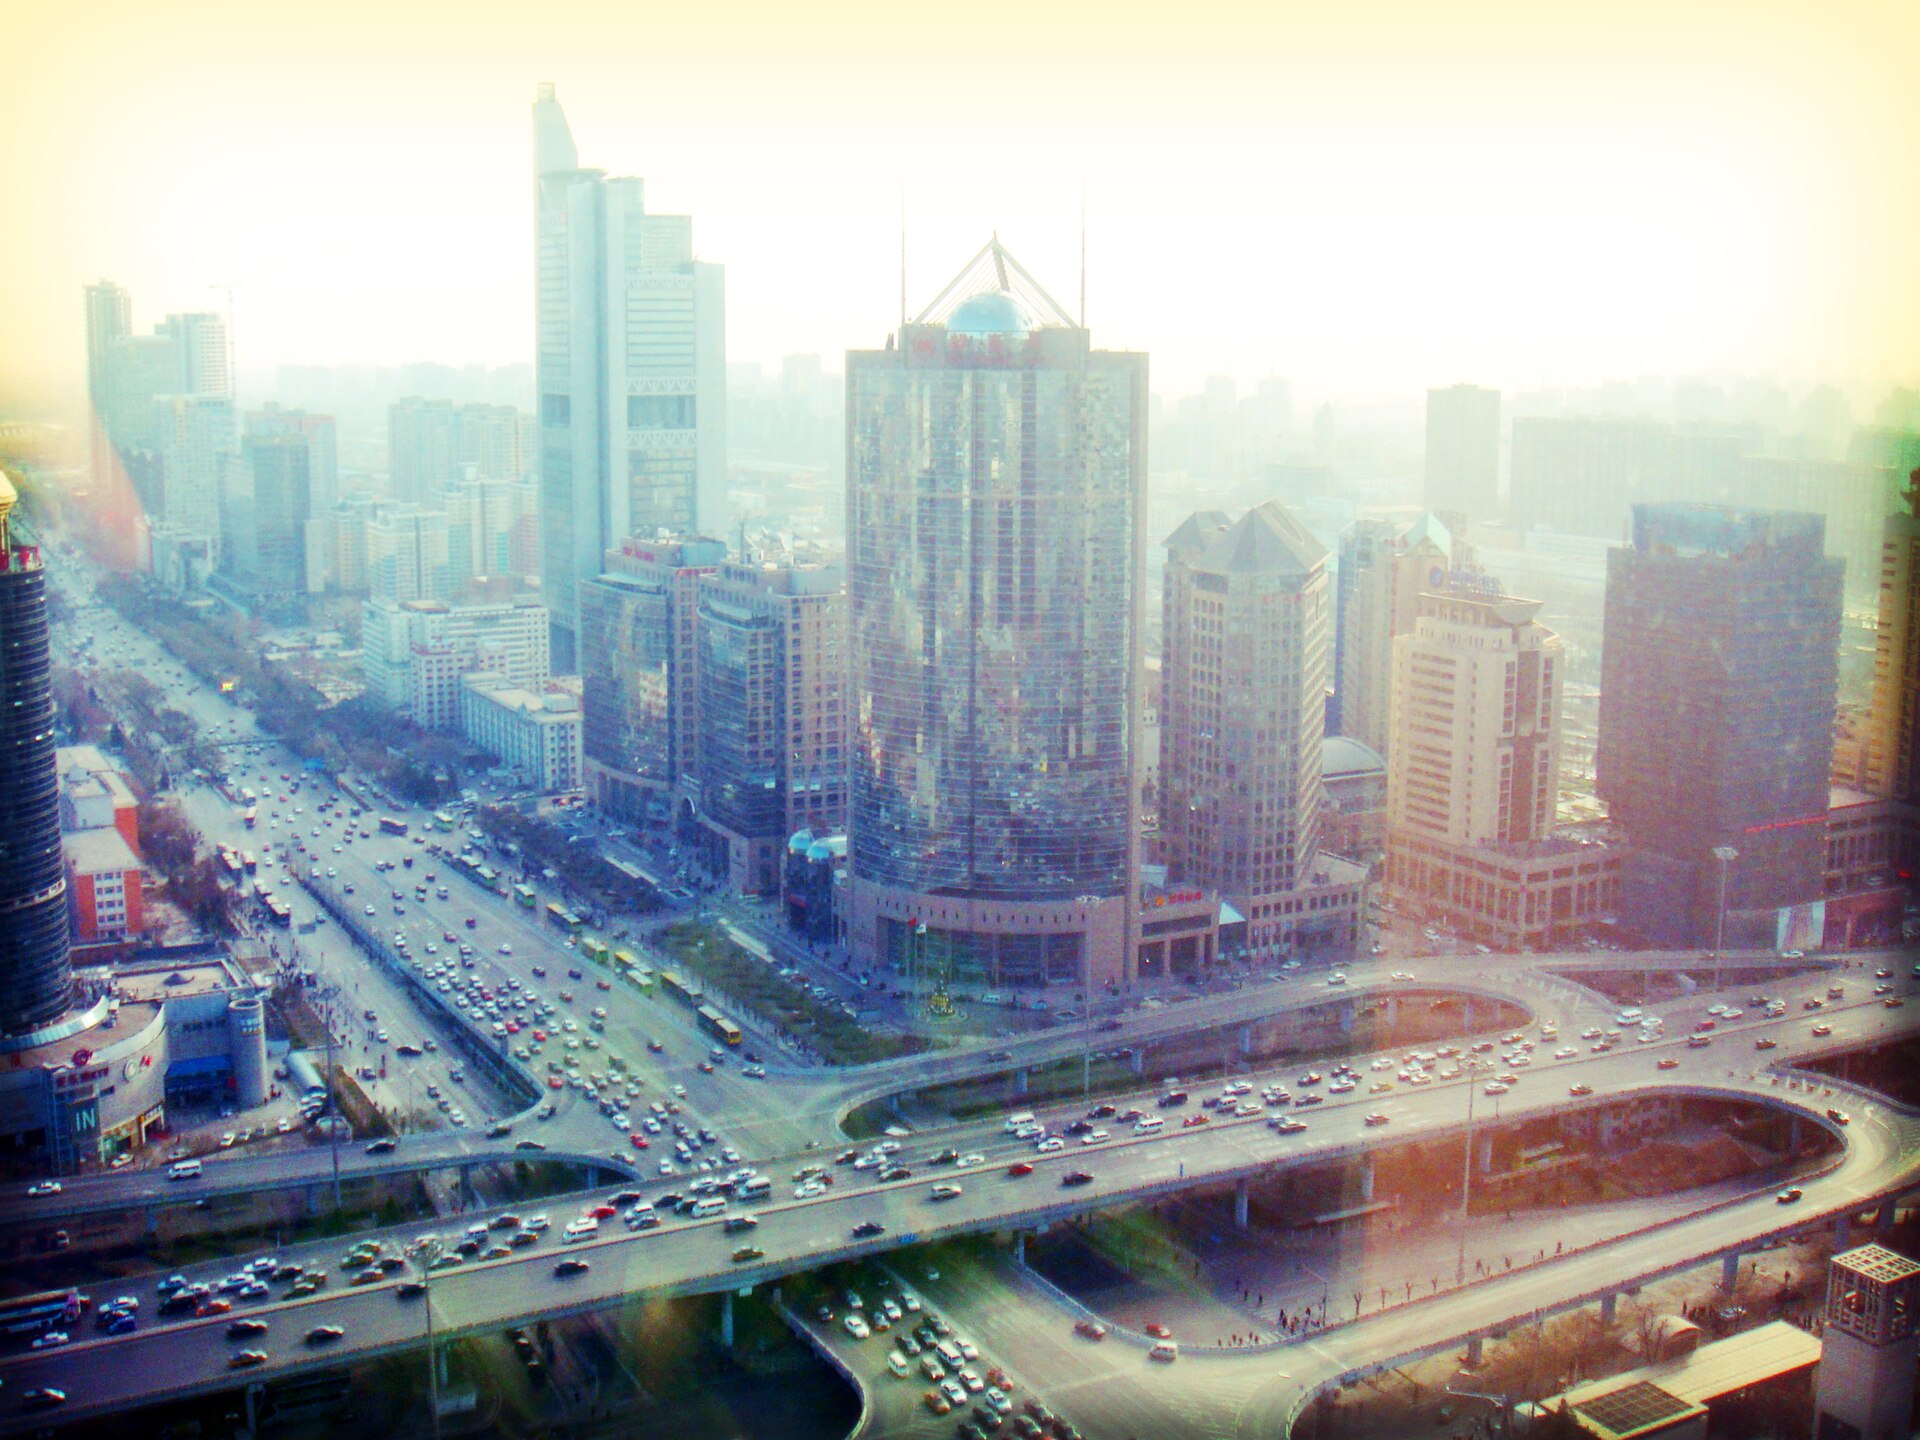
Greater China is 18.5 percent of sample wealth, a little less than the year before. The United States and Greater China together still hold more than half. Average wealth per adult in Greater China rose about 4.6 percent in dollars in 2025, far behind Eastern Europe’s 28 percent in the same dollar measure. Mainland China alone has just over 5.3 million dollar millionaires and 562 billionaires. Financial assets are 51.9 percent. Debt is 10.6 percent. In the brackets from five million to one hundred million dollars, more than half a million adults live there. Since 2000, compound growth in those brackets has run above 20 percent a year, and in one bracket near 30 percent. That is a generation of accumulation. UBS says methods changed, so the past rate is not a contract for the next ten years. The IMF path is 5.0 percent in 2025, 4.5 in 2026, 4.0 in 2027, and 3.3 in 2031.
17
The lines people skip
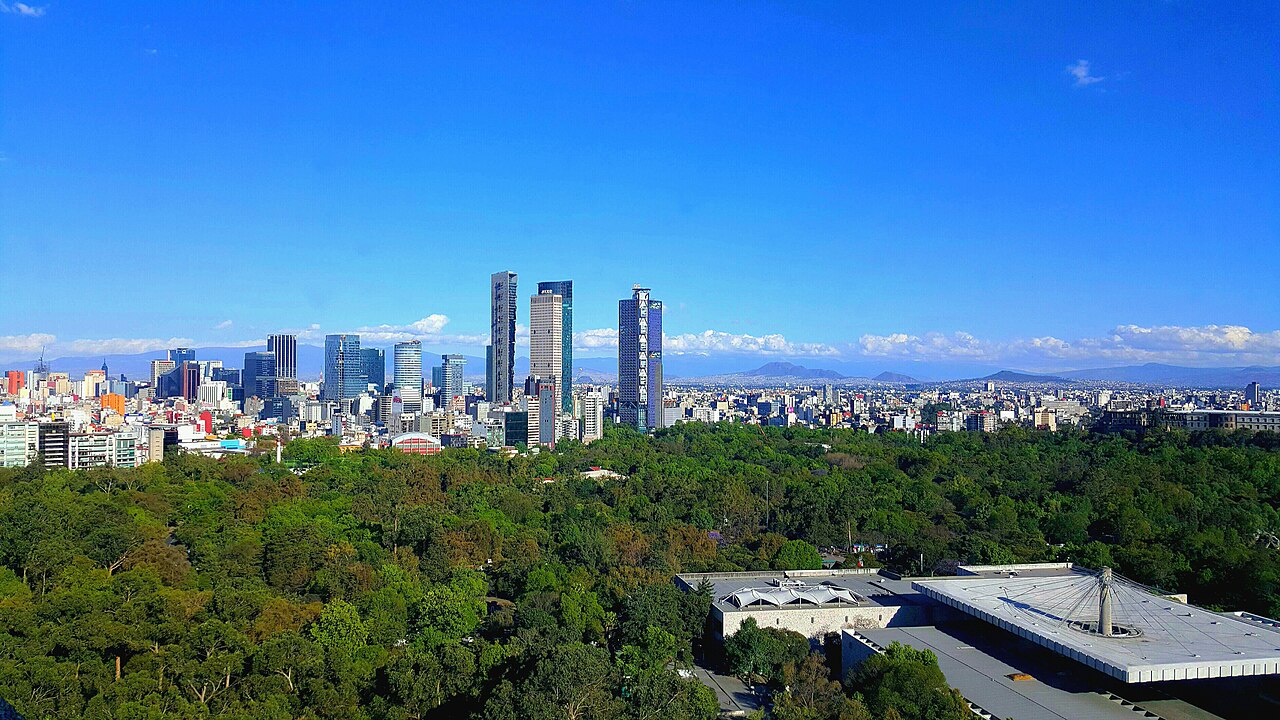
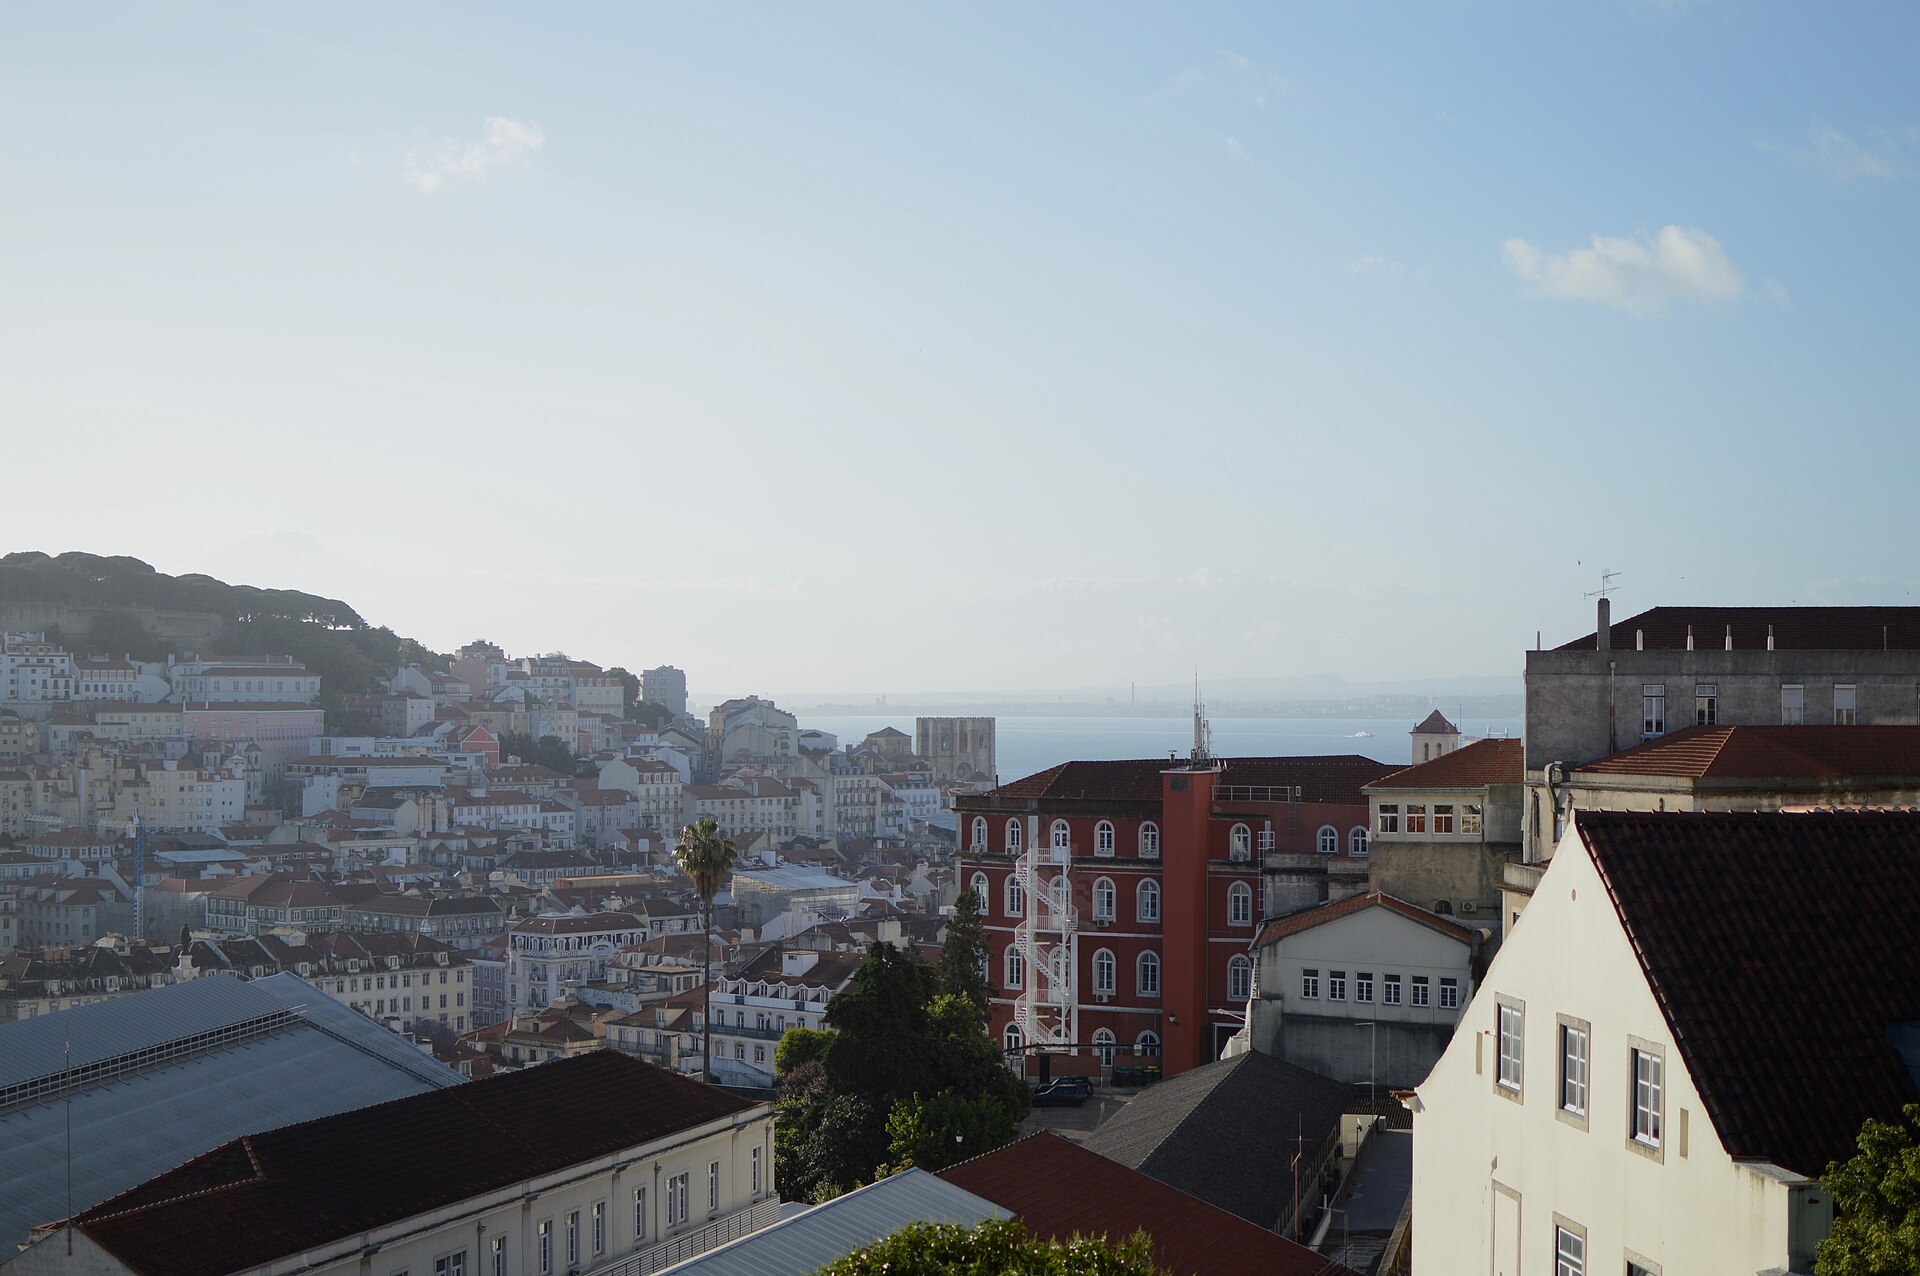
Latin America is 2.5 percent of the stock, with an average near USD 43,000 per adult. Brazil has about 386,000 dollar millionaires. Financial assets are 73.3 percent. Debt is 23.4 percent, among the higher debt ratios this desk prints. Real average wealth per adult is down 3.1 percent since 2020. The IMF has Brazil at 2.2 percent real growth in 2026 and 2.5 percent in 2031. Mexico has about 333,000 millionaires, financial assets 44.3 percent, debt 5.2 percent. Same regional share. Opposite household balance sheets. The São Paulo photograph is 17 August 2005. The Reforma photograph is 15 September 2016. Neither night nor avenue is the 2.5 percent.
18
The decade already lived
The next ten years are easier to fantasize about than the ten years that have already happened. Since 2020, in real local-currency terms, fewer than half the markets have a higher median wealth per adult than at the start of the decade. Japan is up more than 50 percent on the median. The United Arab Emirates is above 40 percent. India, Thailand and Cyprus are near 20 percent. South Korea’s average is up more than 55 percent and its median a little over 12 percent. Russia’s real average is up 37 percent. The United Kingdom’s real average is down 23.2 percent. The Netherlands is down 14.4 percent. France is down 4.5 percent. Brazil is down 3.1 percent. Italy is roughly flat. A decade can already be named before anyone projects the next one.
19
A calendar, not a destiny
The October 2026 World Economic Outlook uses information through 1 October 2026. Its title is Resilience Under Strain, Urgent Choices. World real growth is 3.5 percent in 2025, 3.1 percent in 2026, 3.4 percent in 2027, and 3.1 percent in 2031. Advanced economies as a group are 1.5 percent by 2031. Headline inflation is projected at 4.7 percent in 2026 and 4.1 percent in 2027. Nominal world output at market exchange rates goes from USD 118.485 trillion in 2025 to USD 128.0 trillion in 2026 and USD 161.725 trillion in 2031. Personal wealth in the UBS sample is already a little over four times that 2025 world-output figure. The ratio is a sketch: the wealth sample is about 92 percent of wealth, and the GDP figure is the whole world.
20
Every frame, one more time
The moving picture at the top of this page is the Boulevard of Sabana Grande in Caracas, 17 May 2018, filmed by Vicente Quintero and released under CC BY 3.0. People are walking. A street is not a wealth statistic, and this is not the New York photograph. The background behind the pages is the Jacksonville skyline at night on 17 January 2008, Jonathan Zander (Digon3), CC BY-SA 3.0. That file is not printed again in the essay. The New York Stock Exchange facade, 16 August 2017, Arild Vågen, CC BY-SA 4.0, is on the Places page. The building is not 35.7 percent.
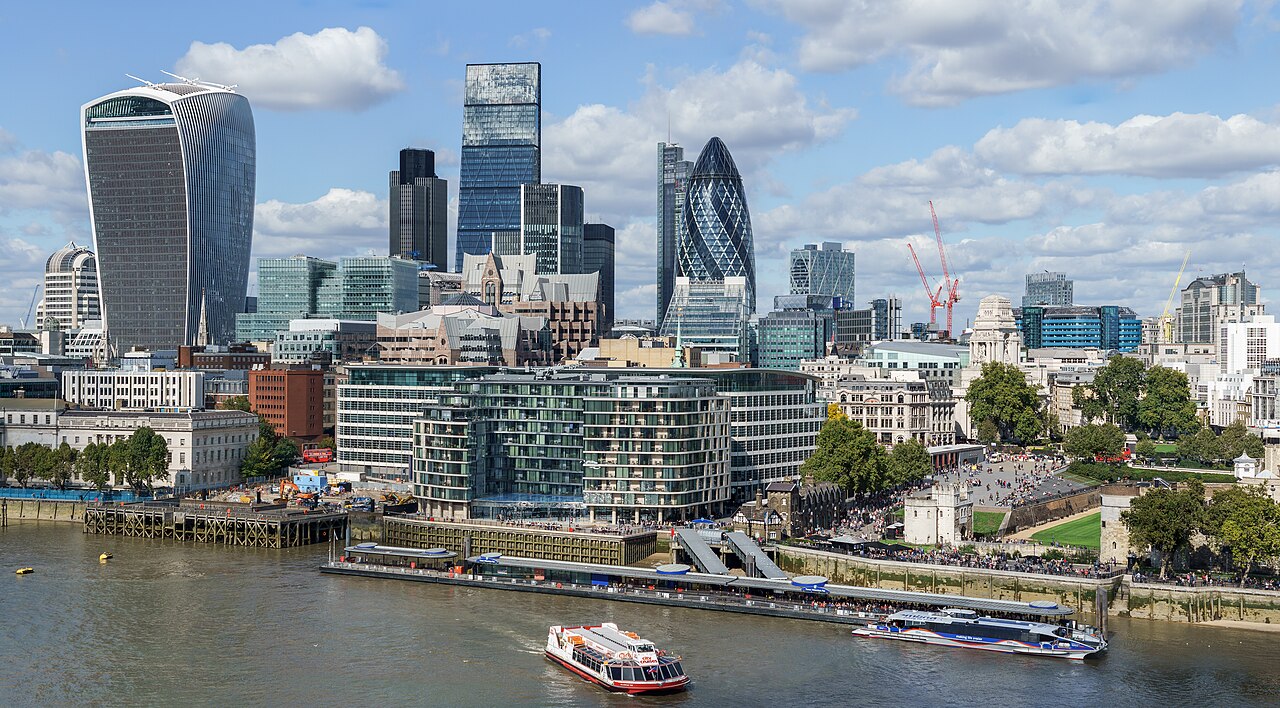
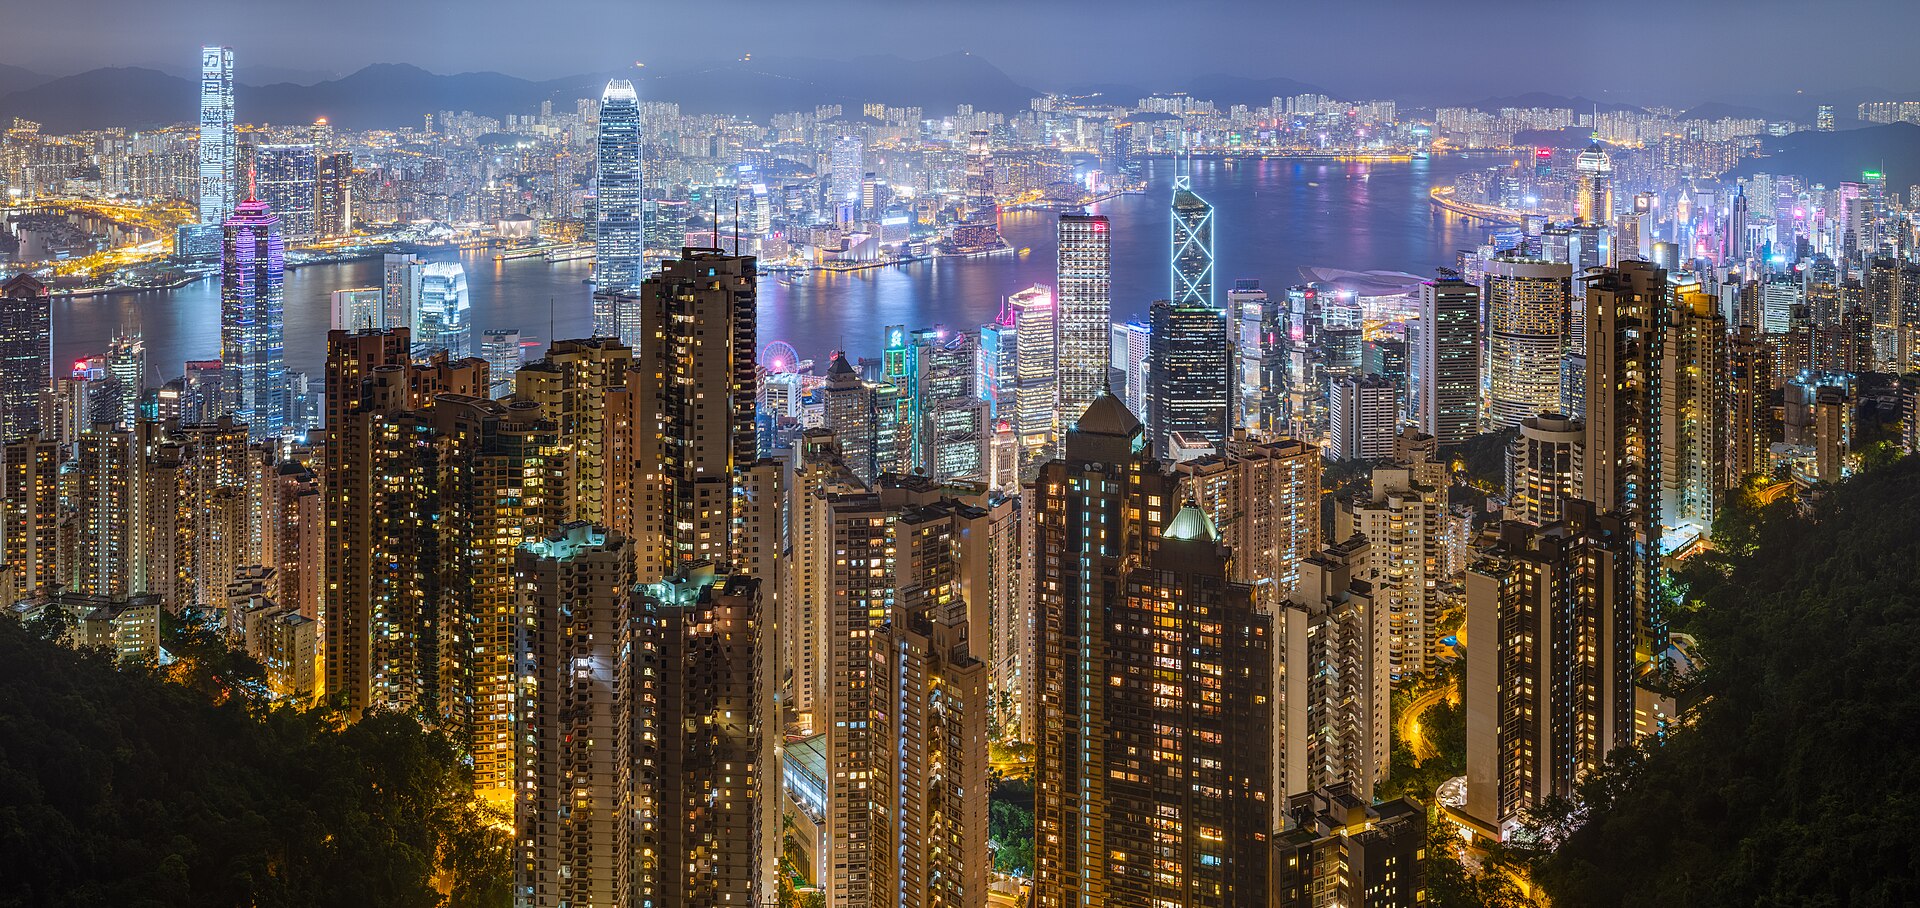
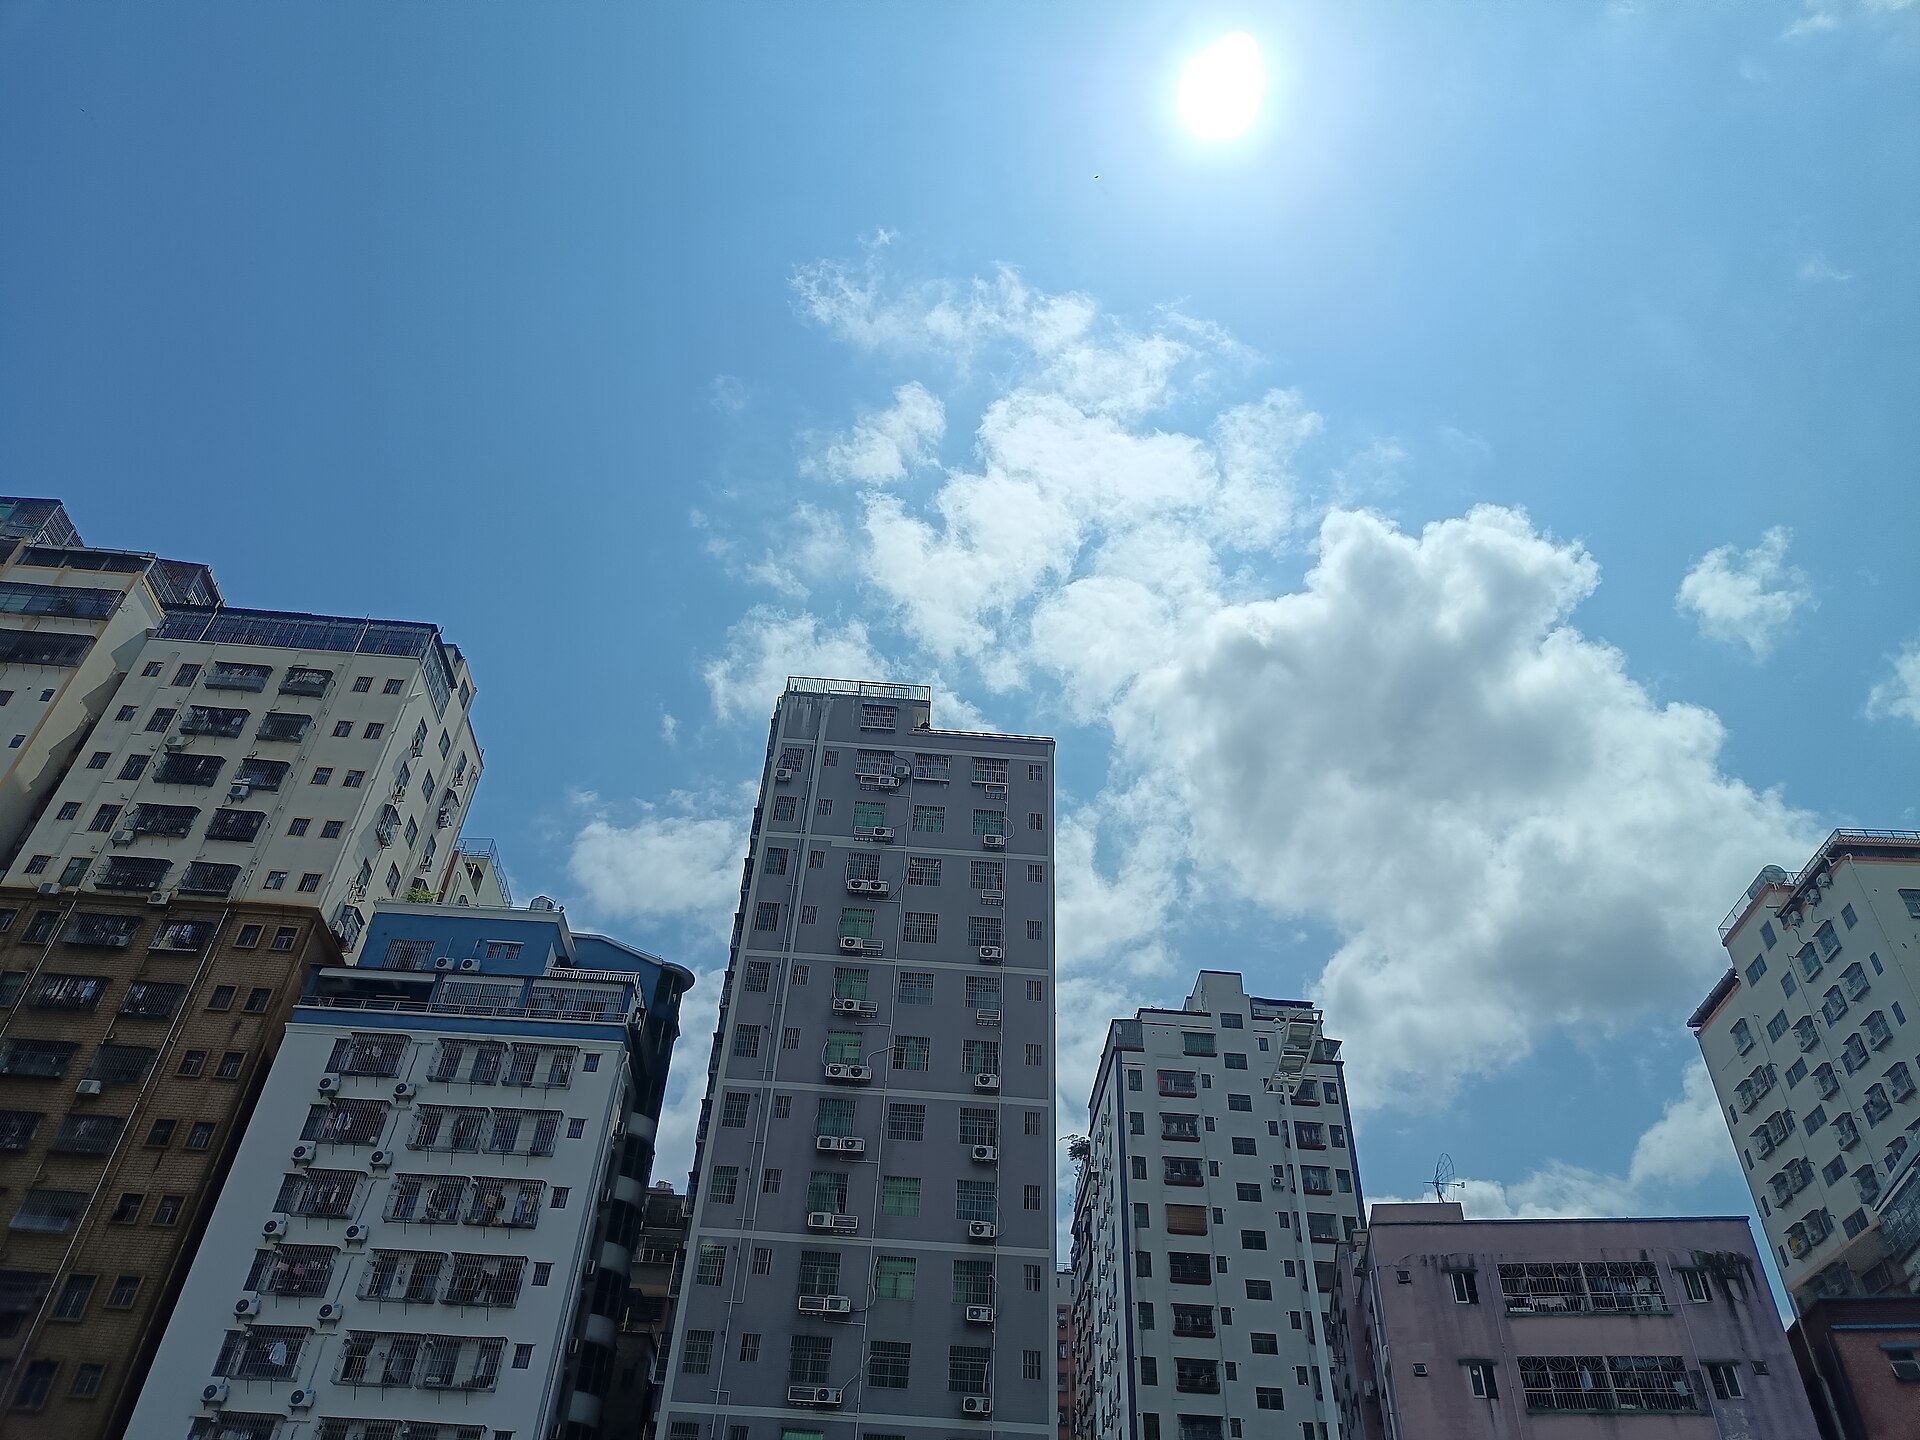
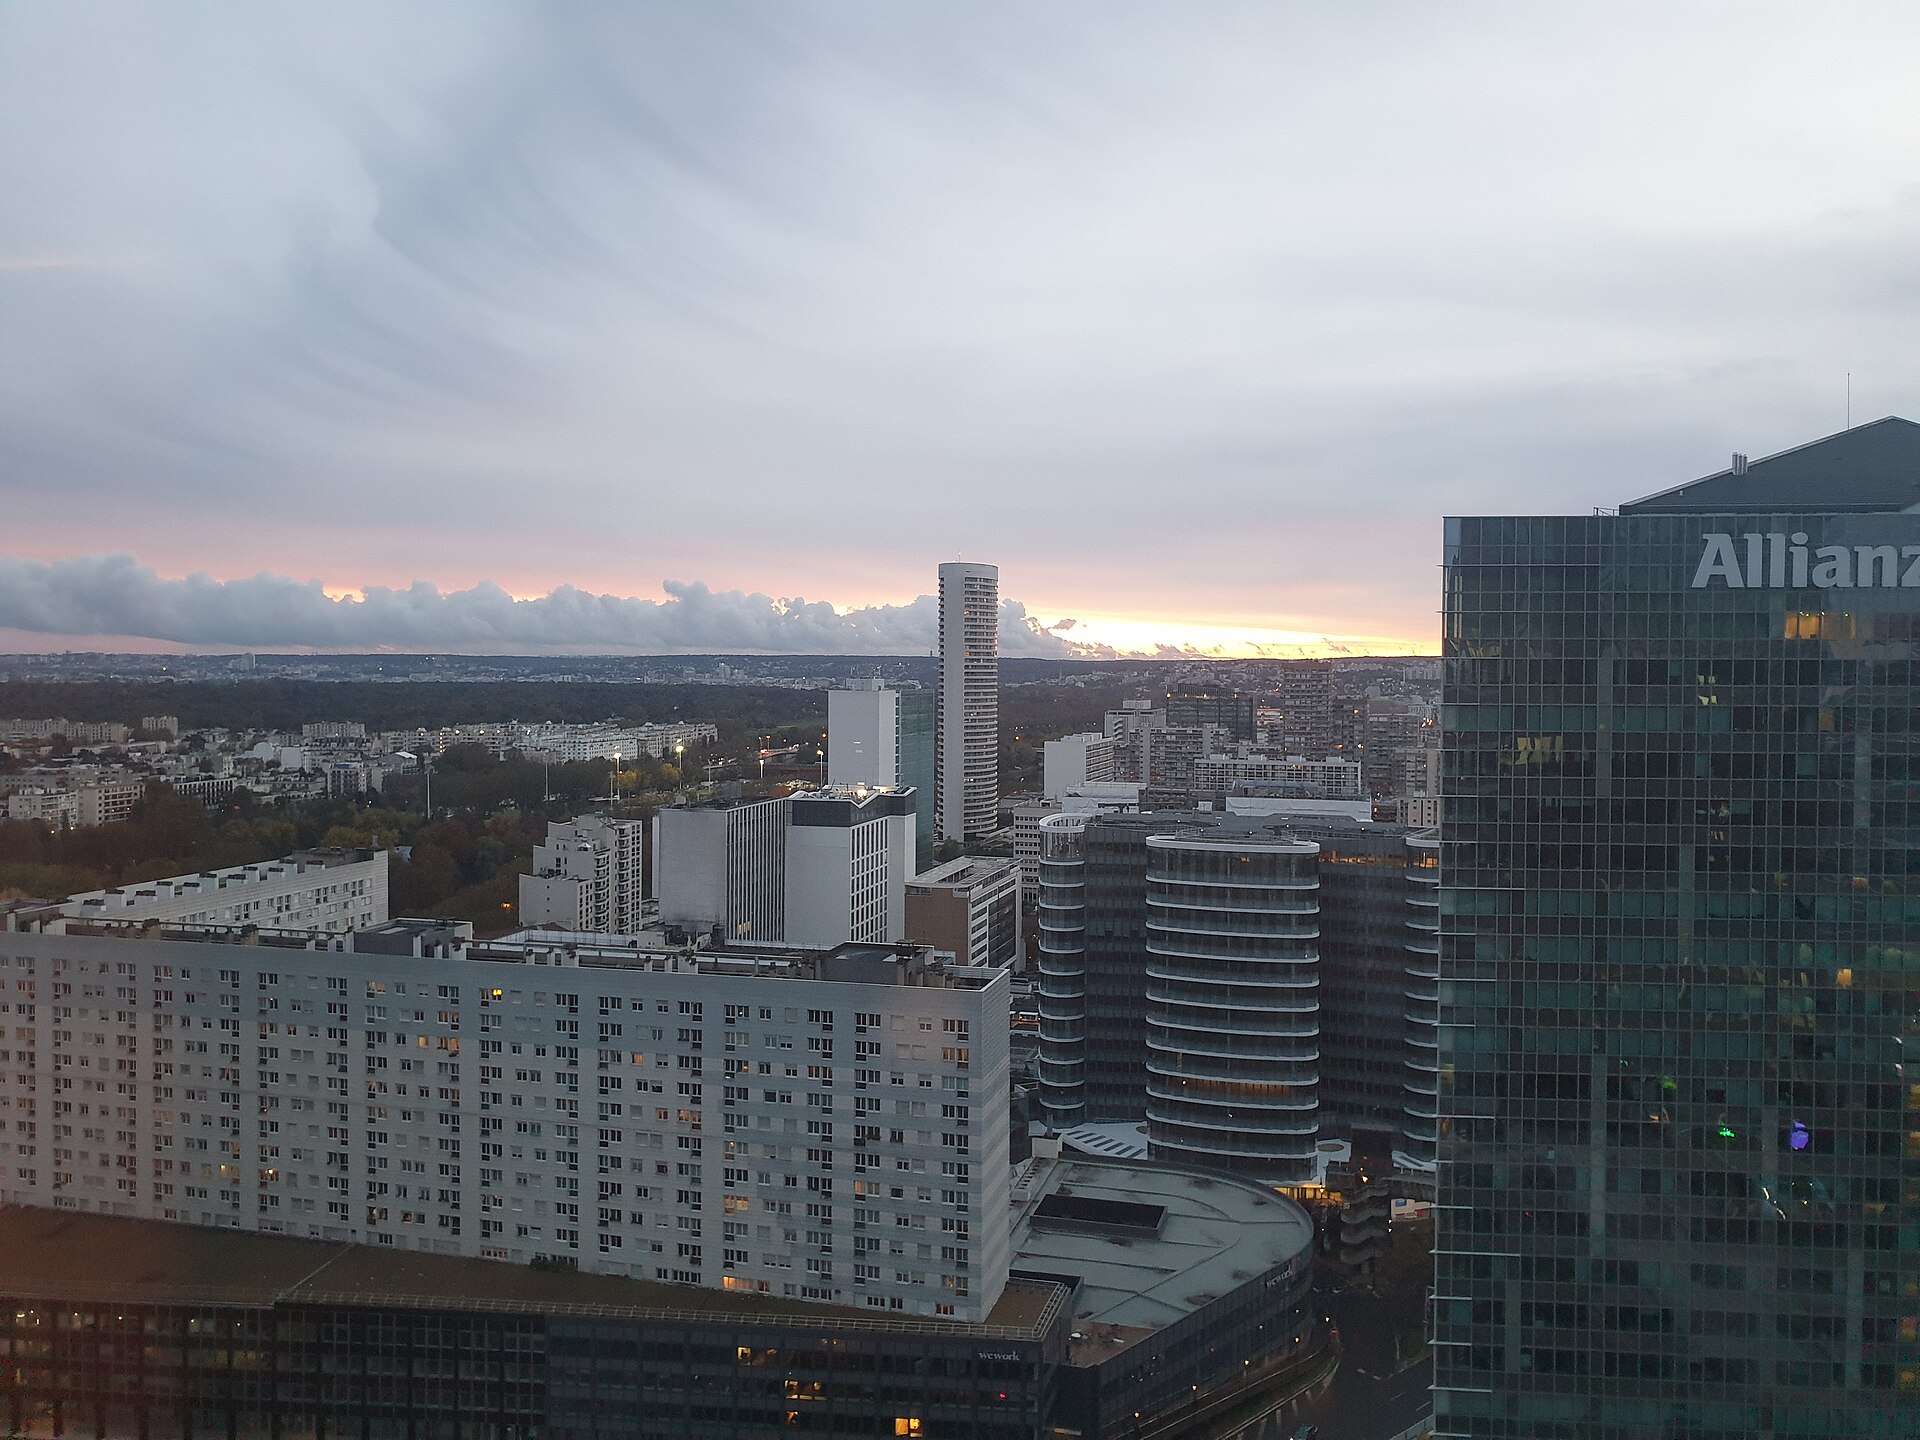
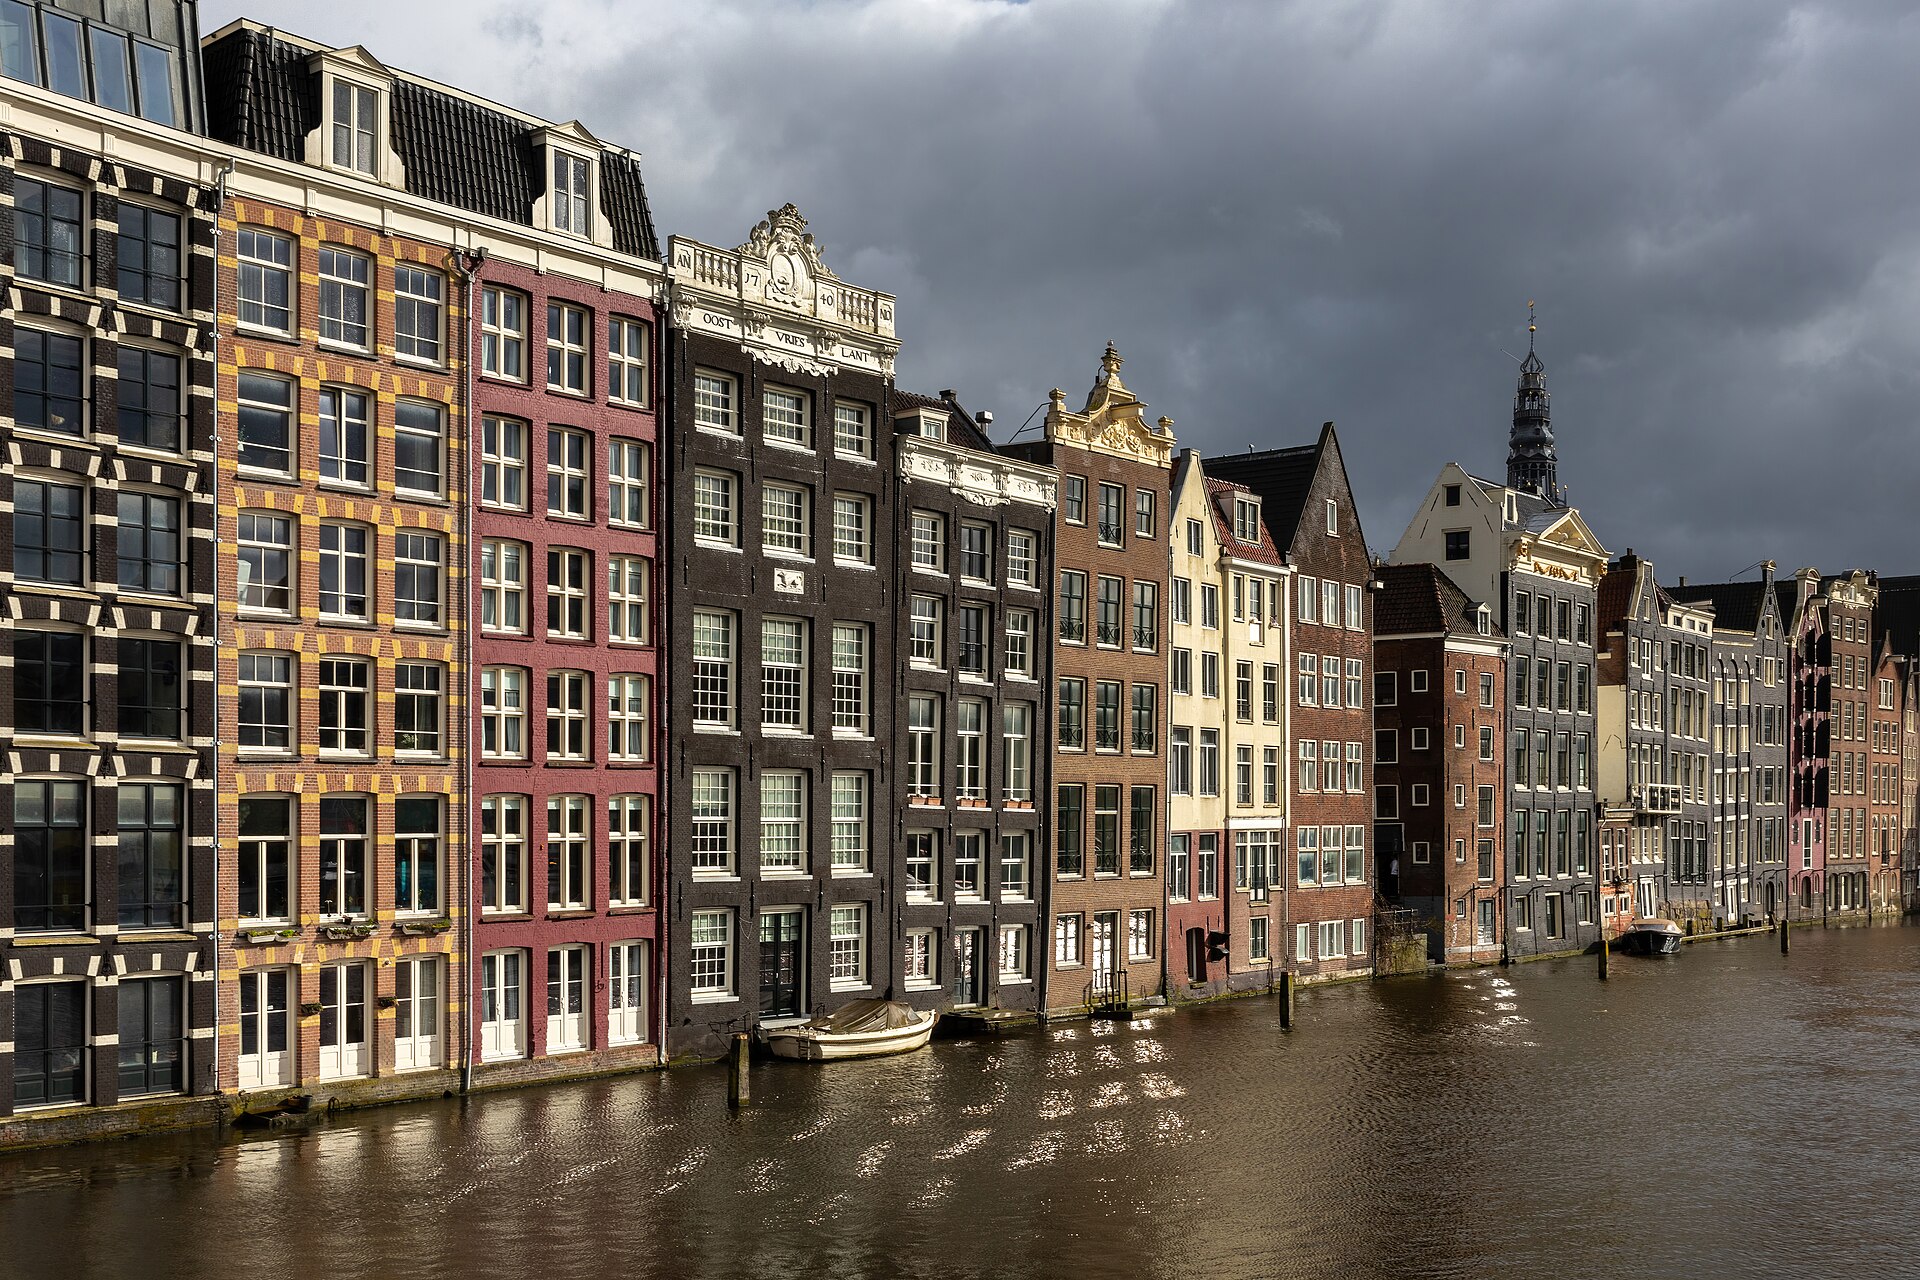
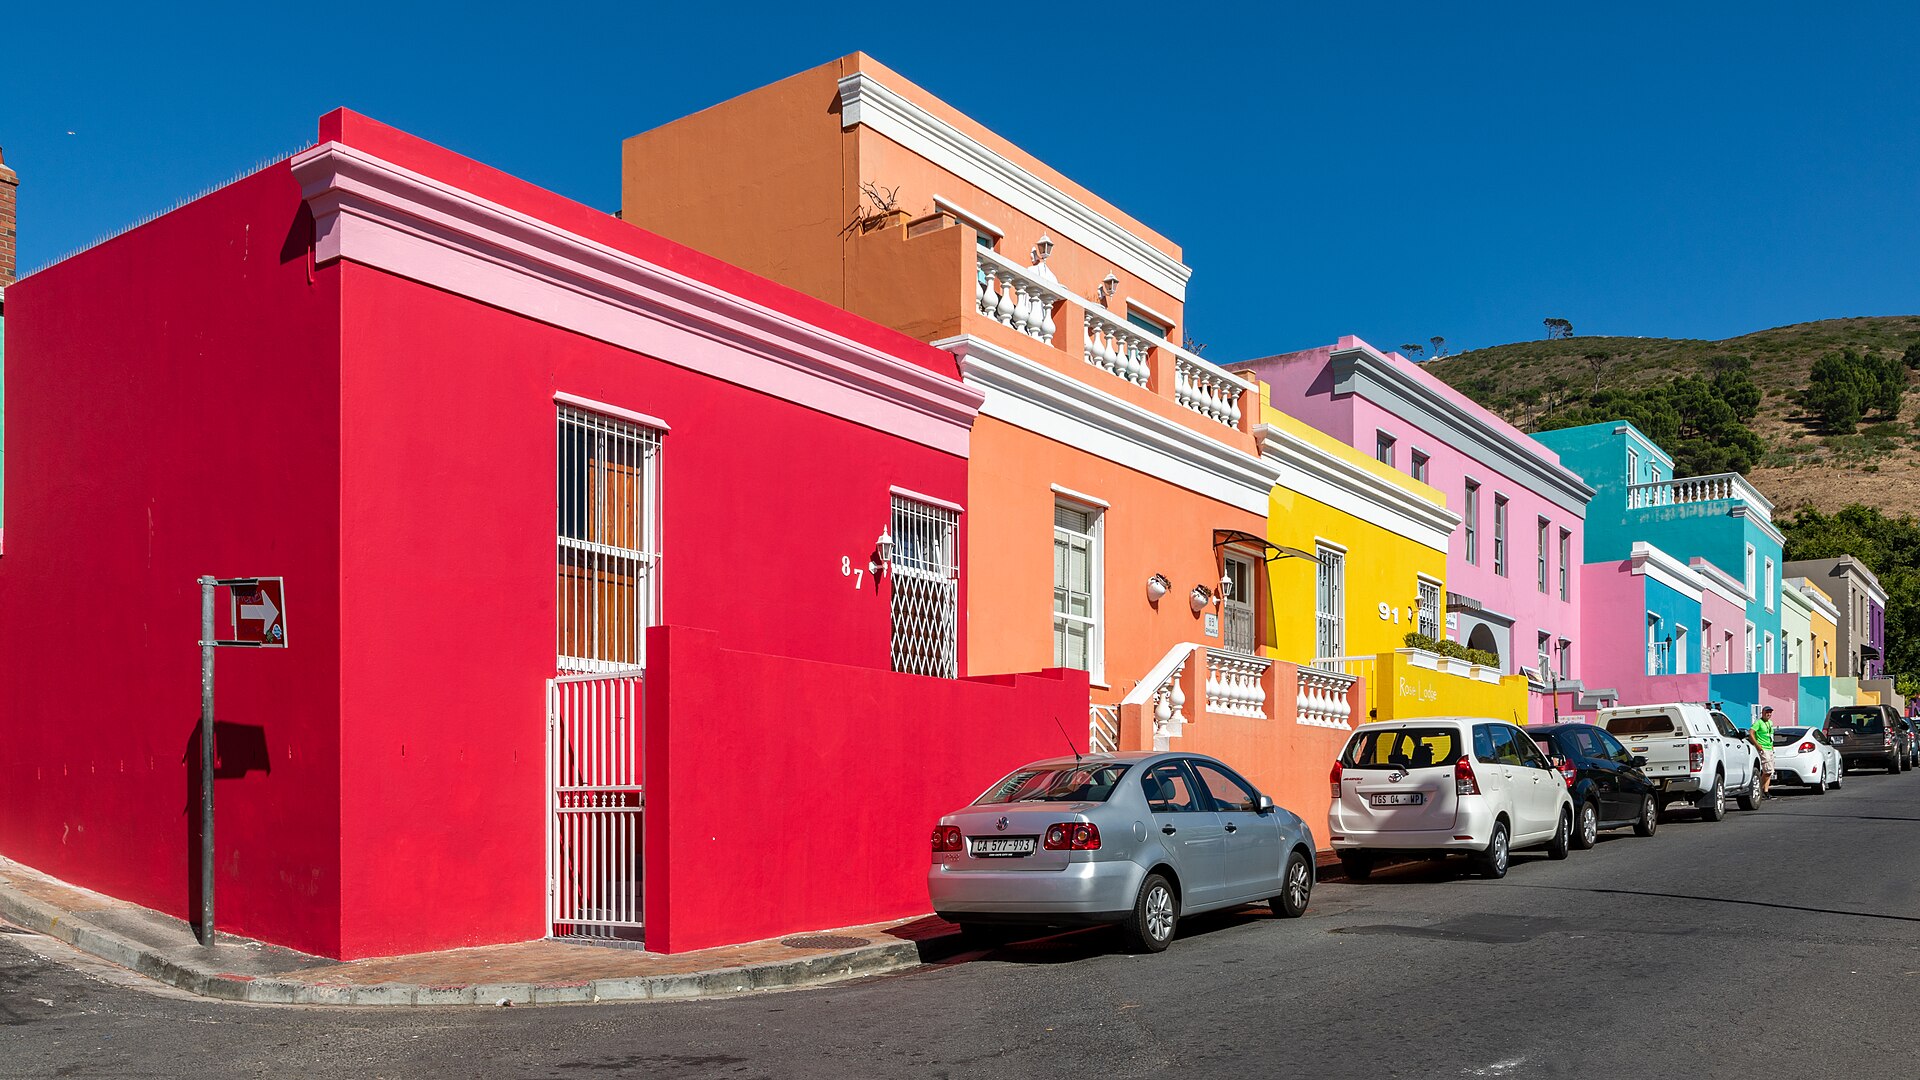
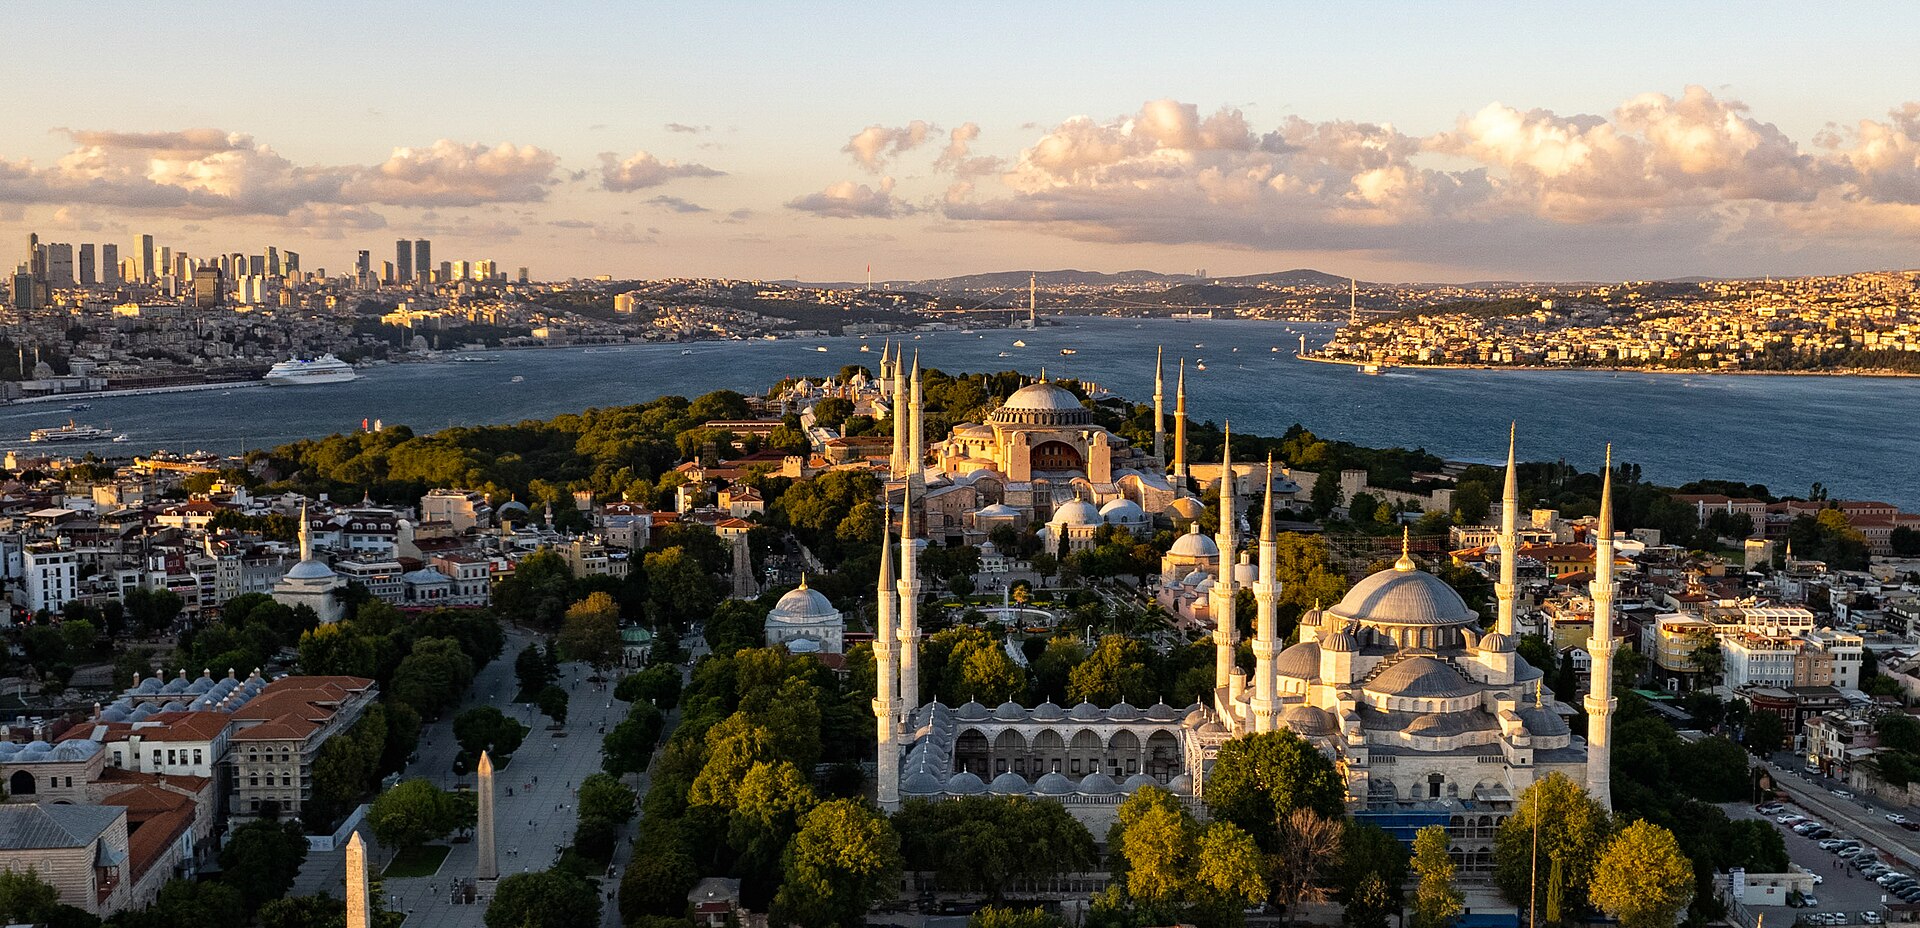
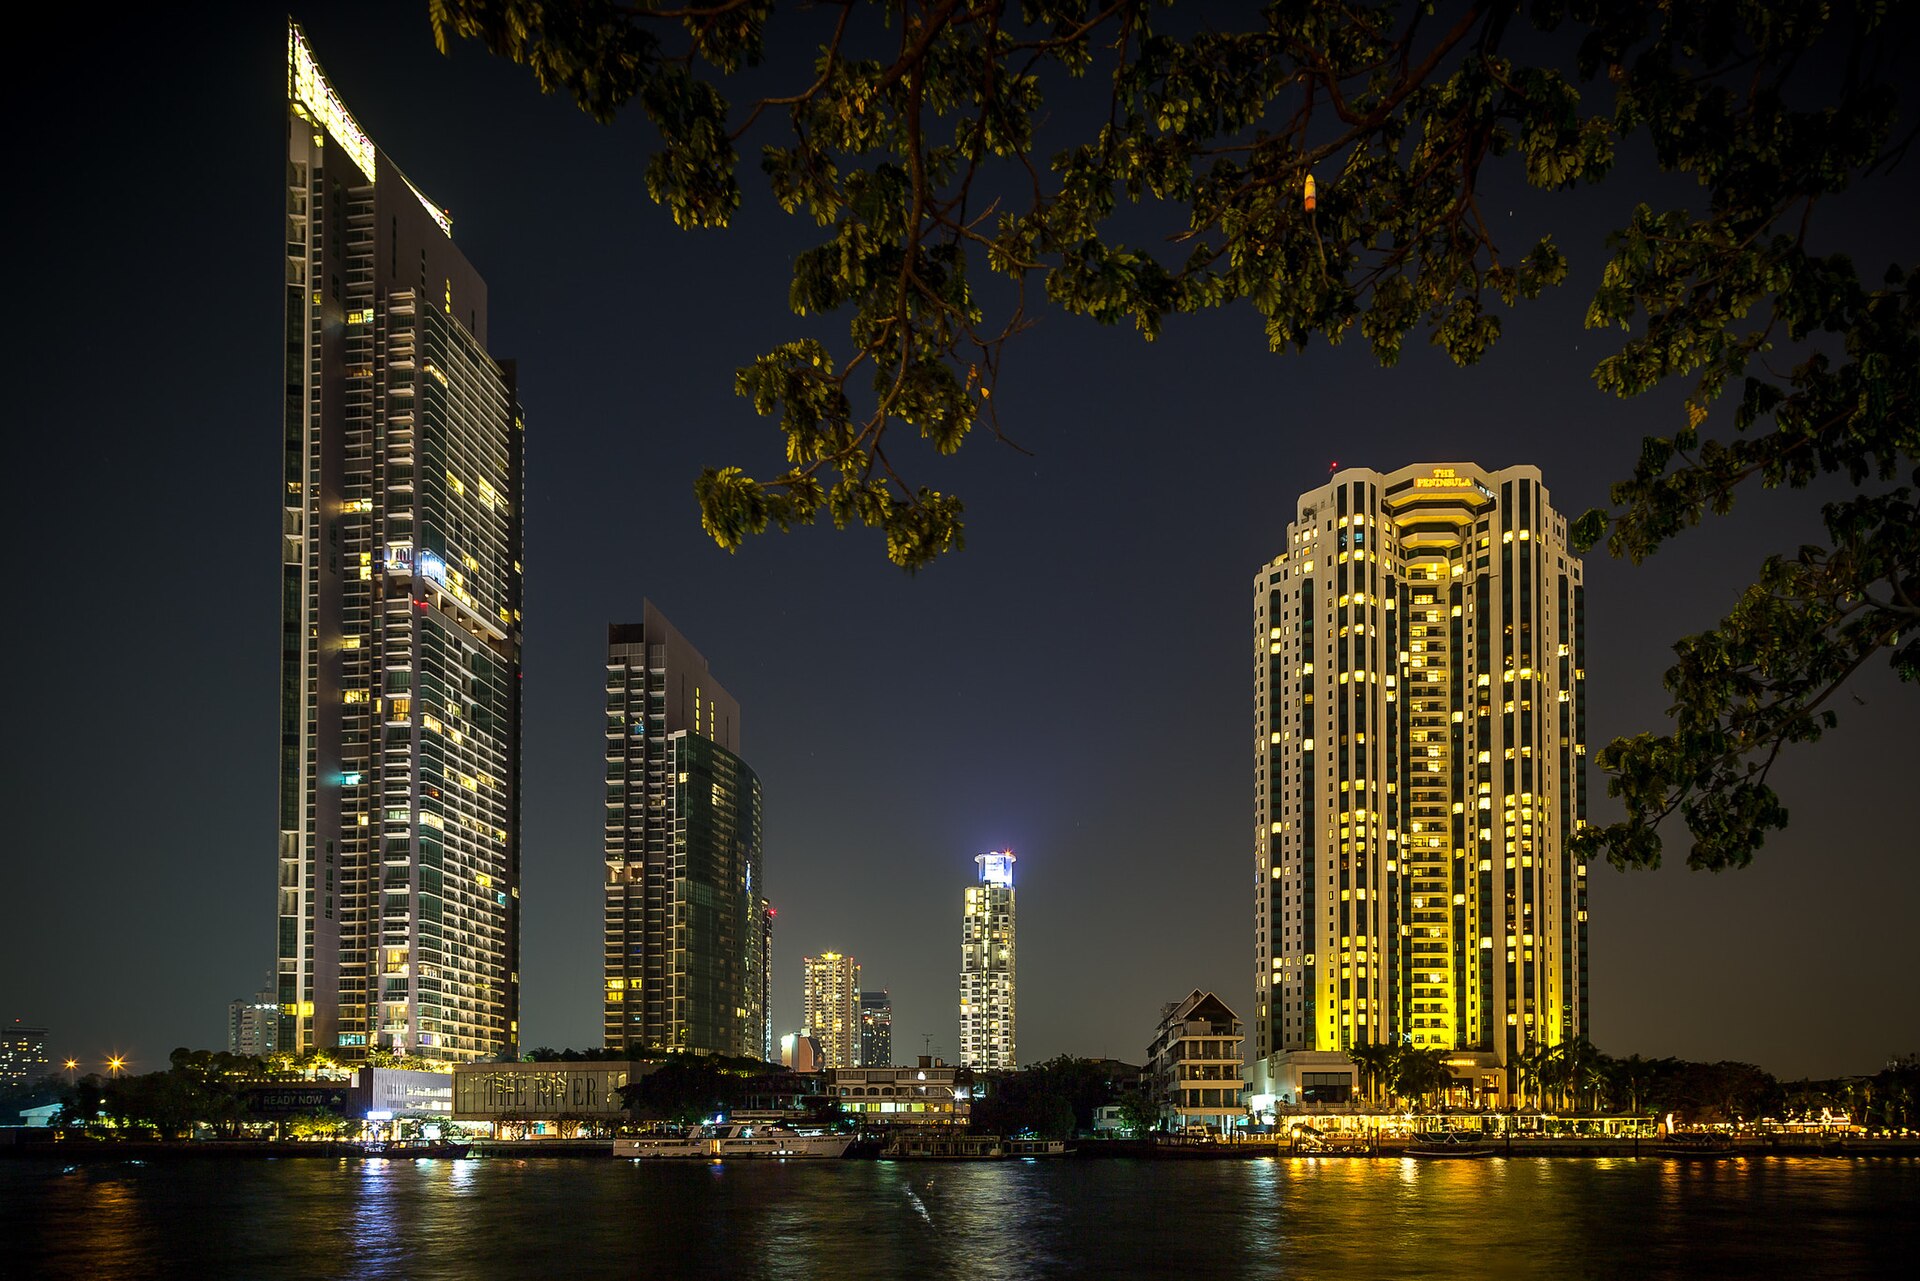
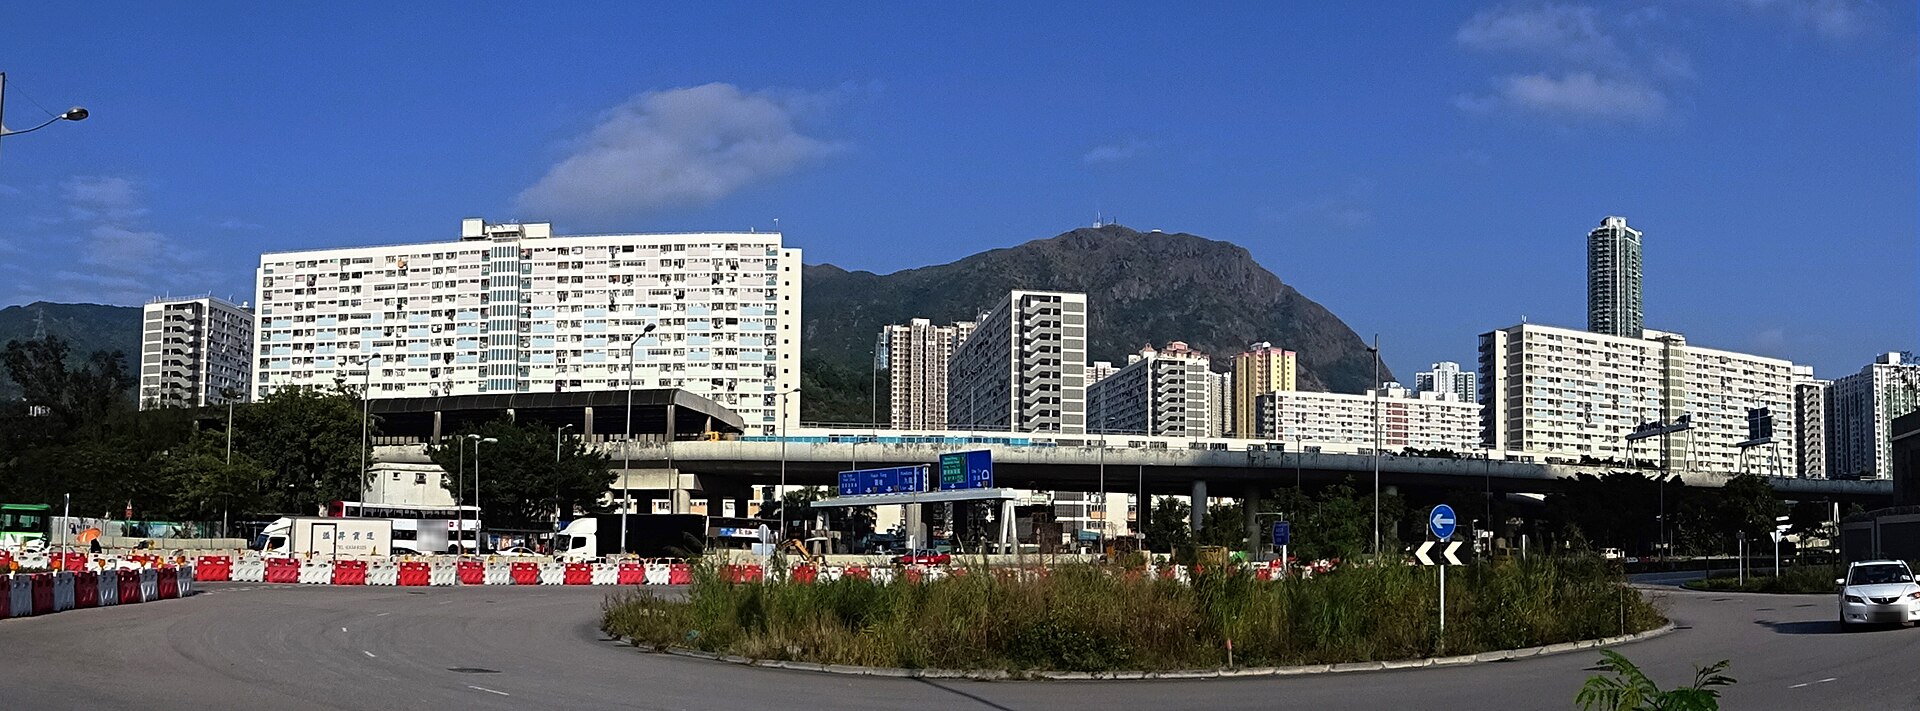
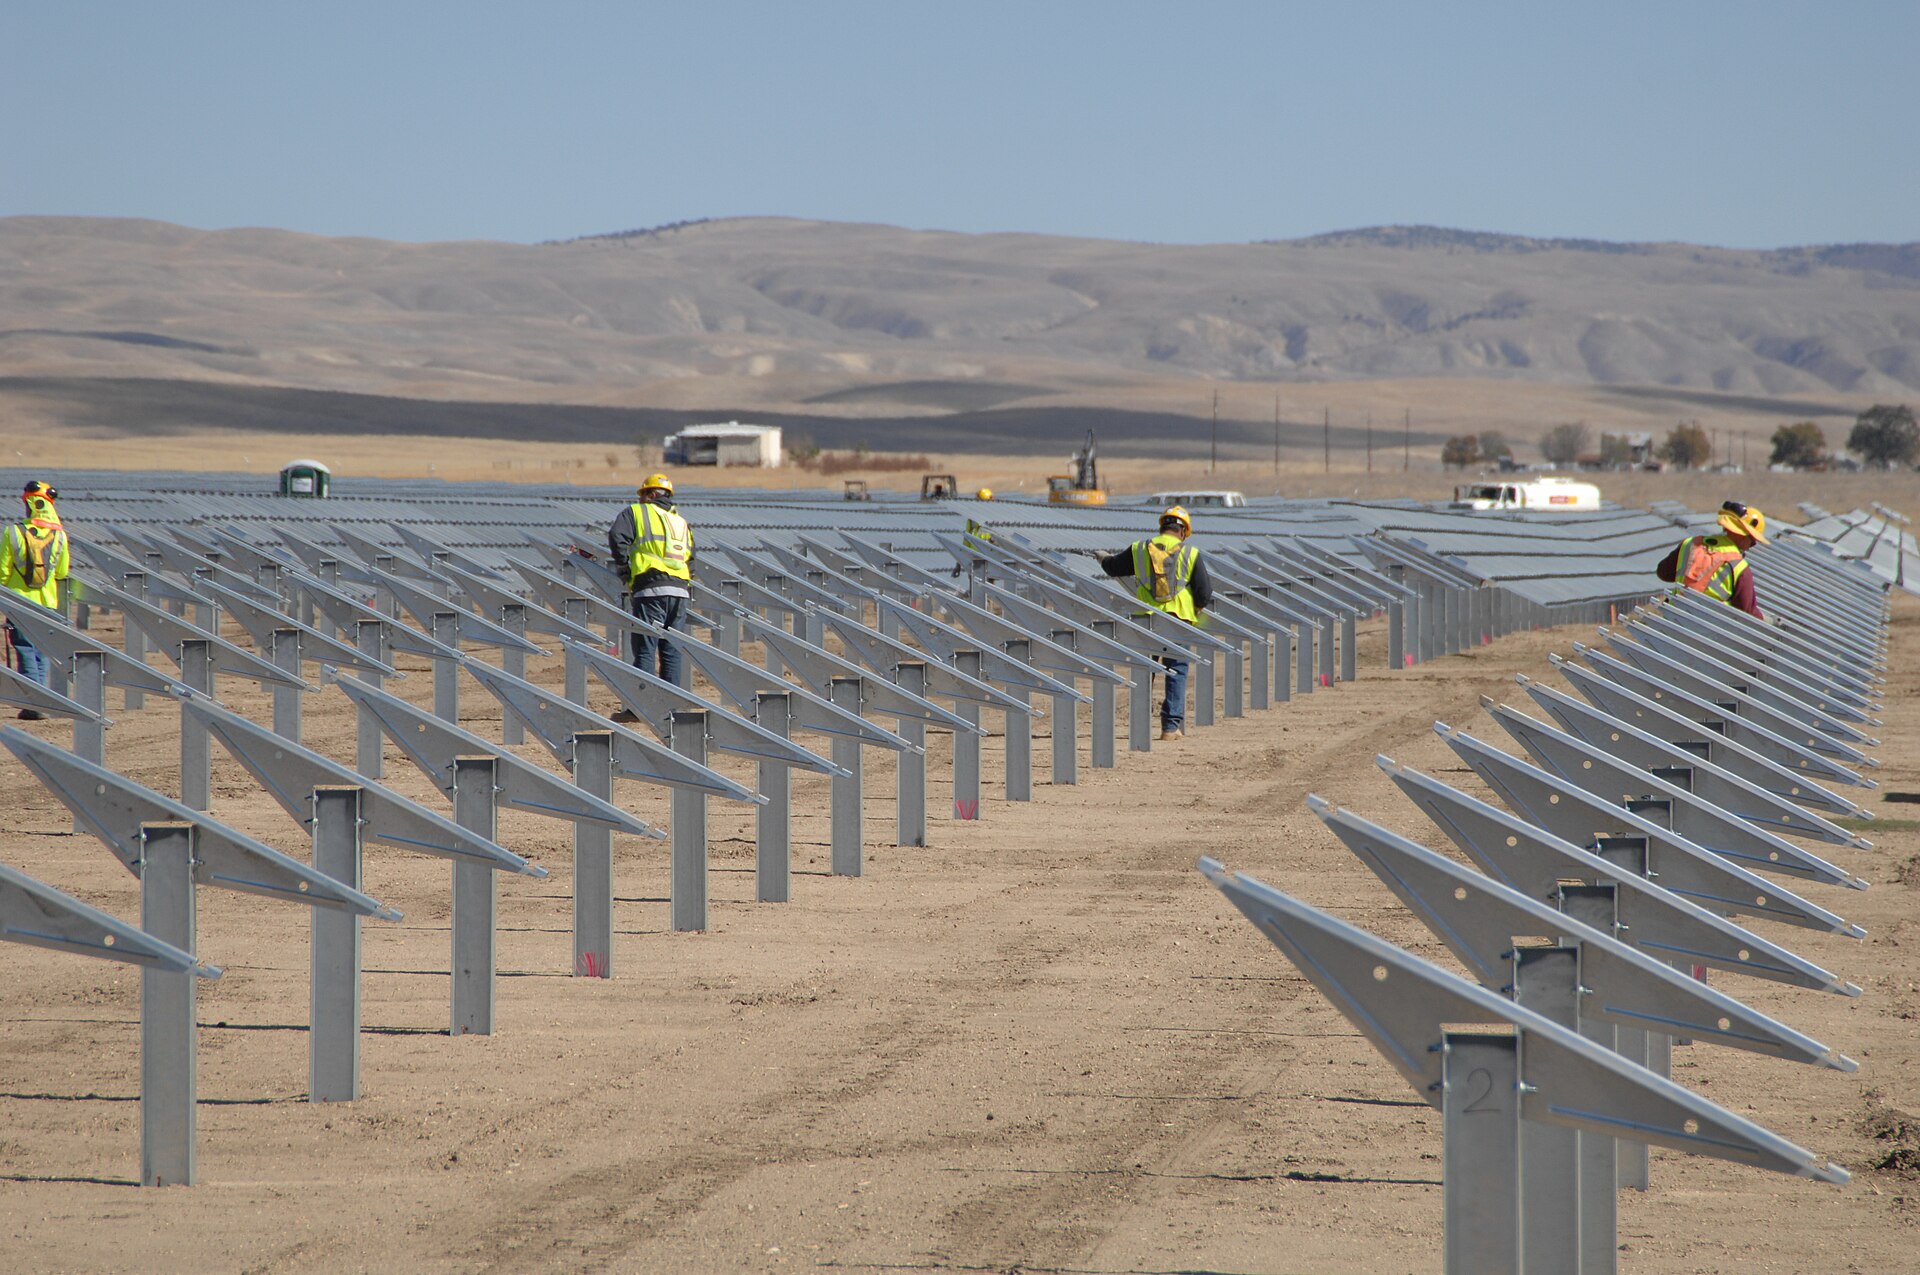
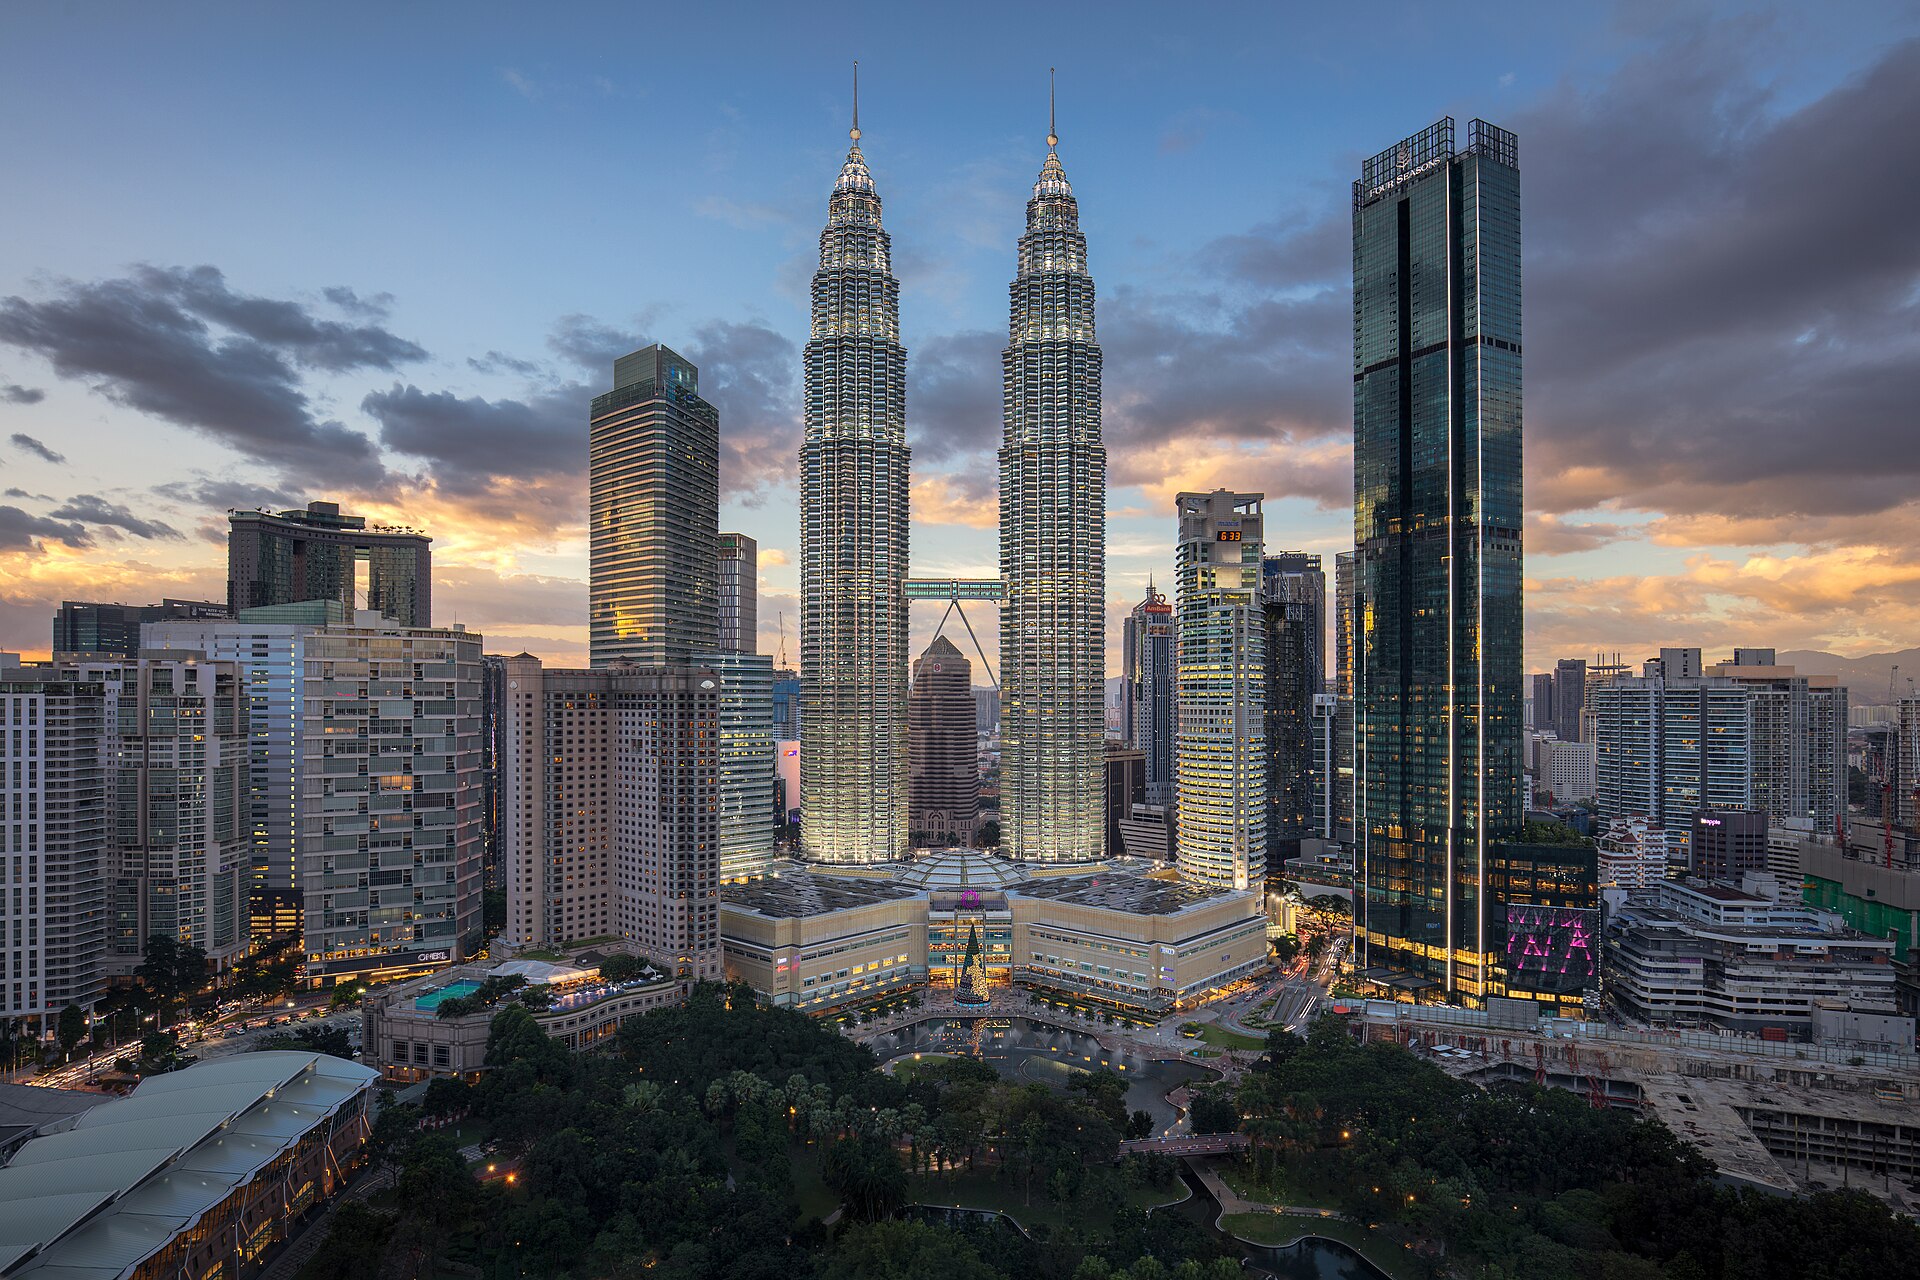
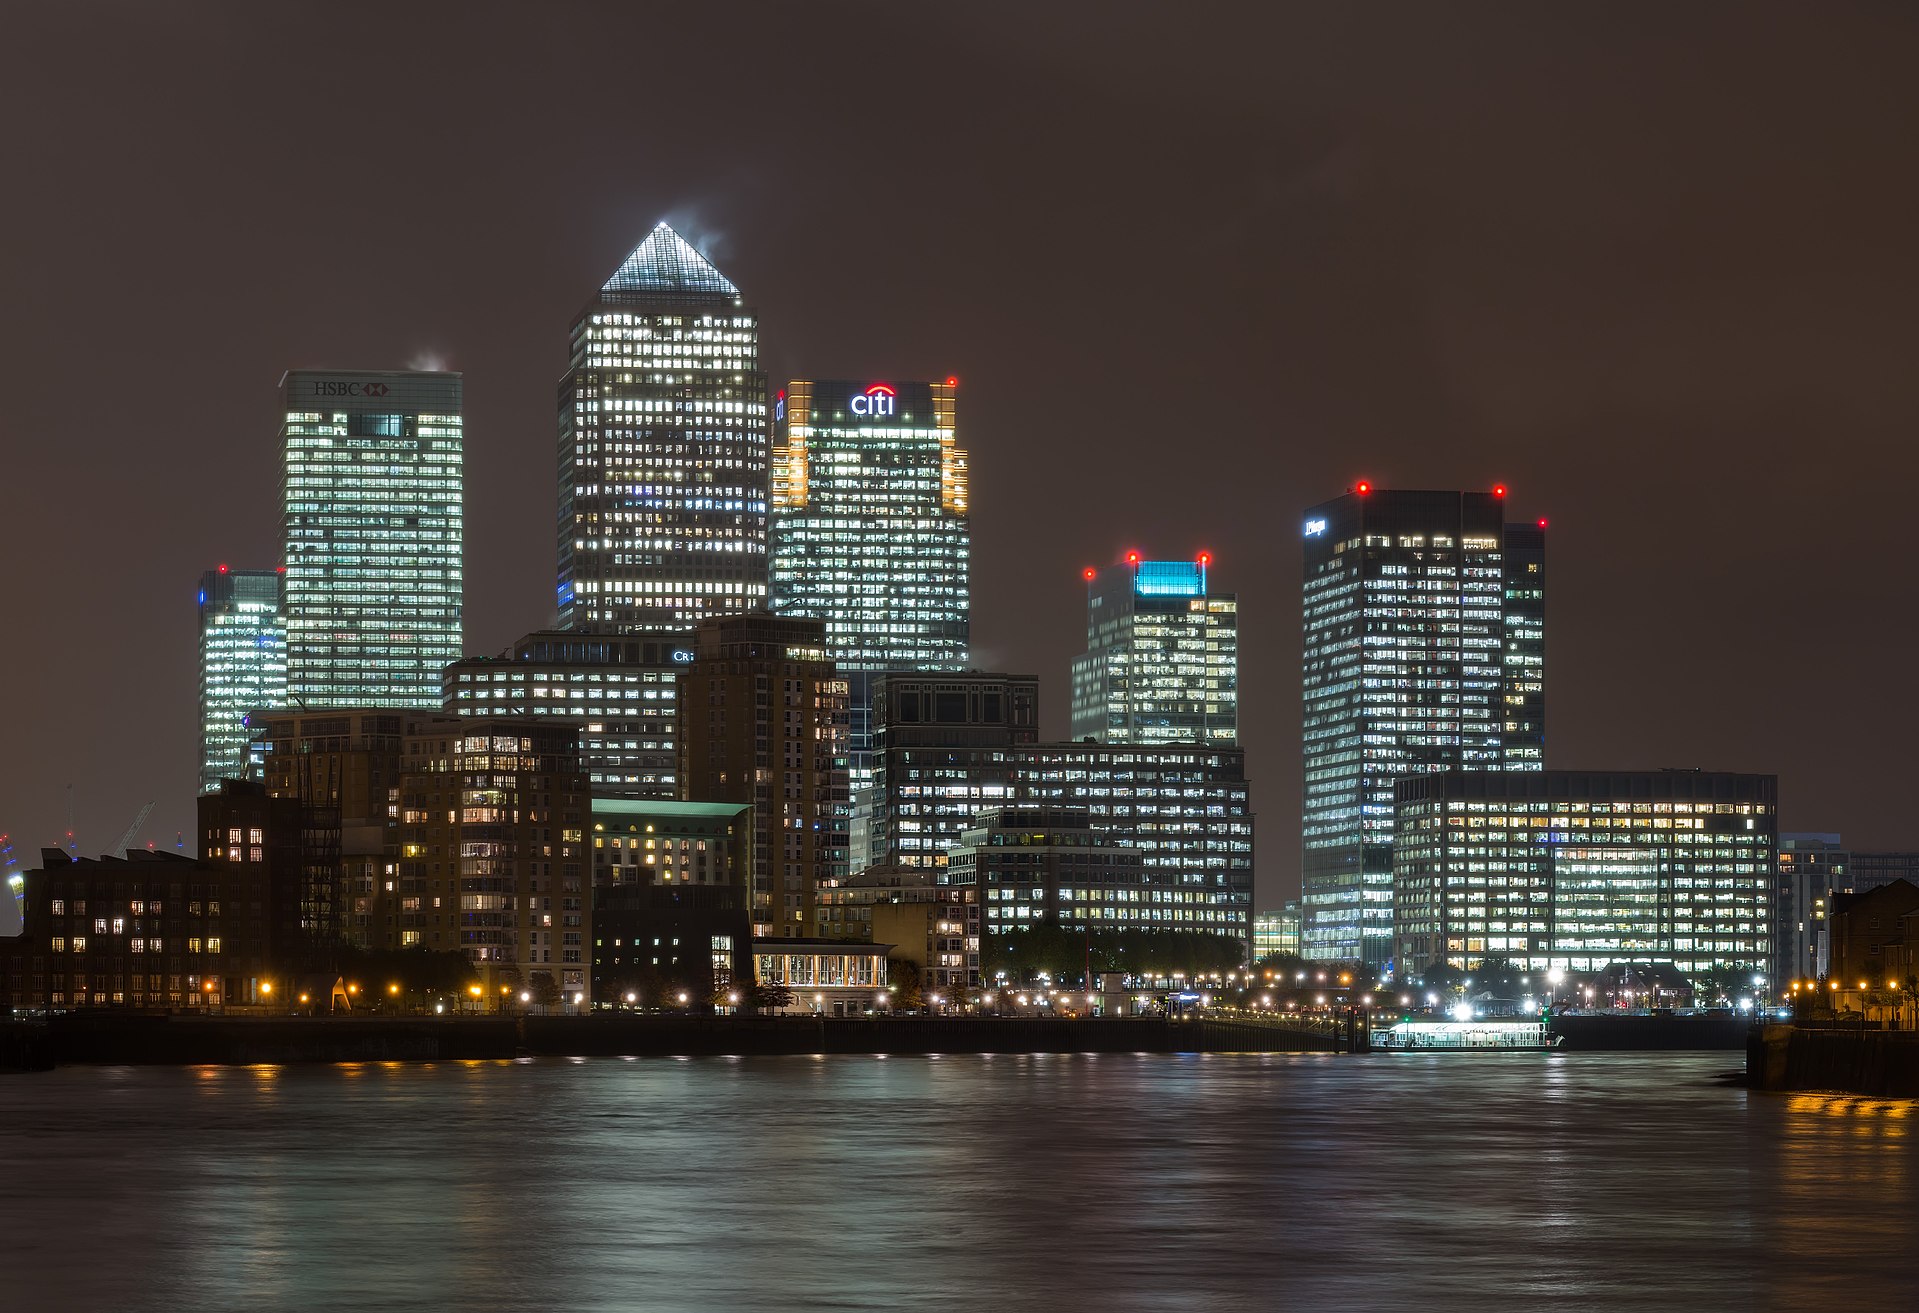
The later frames, so the register stays as long as the page. Toronto’s financial district, 5 August 2017, Arild Vågen, CC BY-SA 4.0. Chicago before dawn, 15 March 2026, NorbertNagel, CC BY-SA 4.0. La Défense from a hotel lounge, 30 October 2021, Bretwa, CC BY-SA 4.0. Damrak in Amsterdam, 24 April 2024, Basile Morin, CC BY-SA 4.0. Jakarta from Gambir Station, 29 February 2020, Sam Hidayat, CC BY-SA 4.0. The Petronas Towers, 3 December 2019, James Kerwin, CC BY 2.0. Victoria Harbour, 11 June 2019, Benh LIEU SONG, CC BY-SA 4.0. Shenzhen, 27 March 2025, Fumikas Sagisavas, CC0. Beijing from Guomao, 23 December 2011, The Erica Chang, CC BY 3.0. Choi Hung Estate, 13 January 2016, Exploringlife, CC BY-SA 4.0. Canary Wharf from Wapping, 29 October 2012, Diliff, CC BY-SA 3.0. Chao Phraya at night, 9 January 2014, Wolfgang Weber, CC BY 3.0. Istanbul, 19 July 2022, Hunanuk, CC0. Wale Street in Cape Town, 2 March 2024, Dietmar Rabich, CC BY-SA 4.0. Tejuoso market, 20 April 2018, Biggiepopa, CC BY-SA 4.0. Topaz Solar Farm, 24 October 2012, Sarah Swenty / USFWS, CC BY 2.0. Each one is a place on a day. None of them is a wealth total.
21
How to stay with the desk
If you have read this far at a normal pace, you have already used a long sitting, and the other four pages are still ahead of you. The clock in the corner is only a clock. It carries across the other pages for as long as this browser tab remembers the visit.
Places
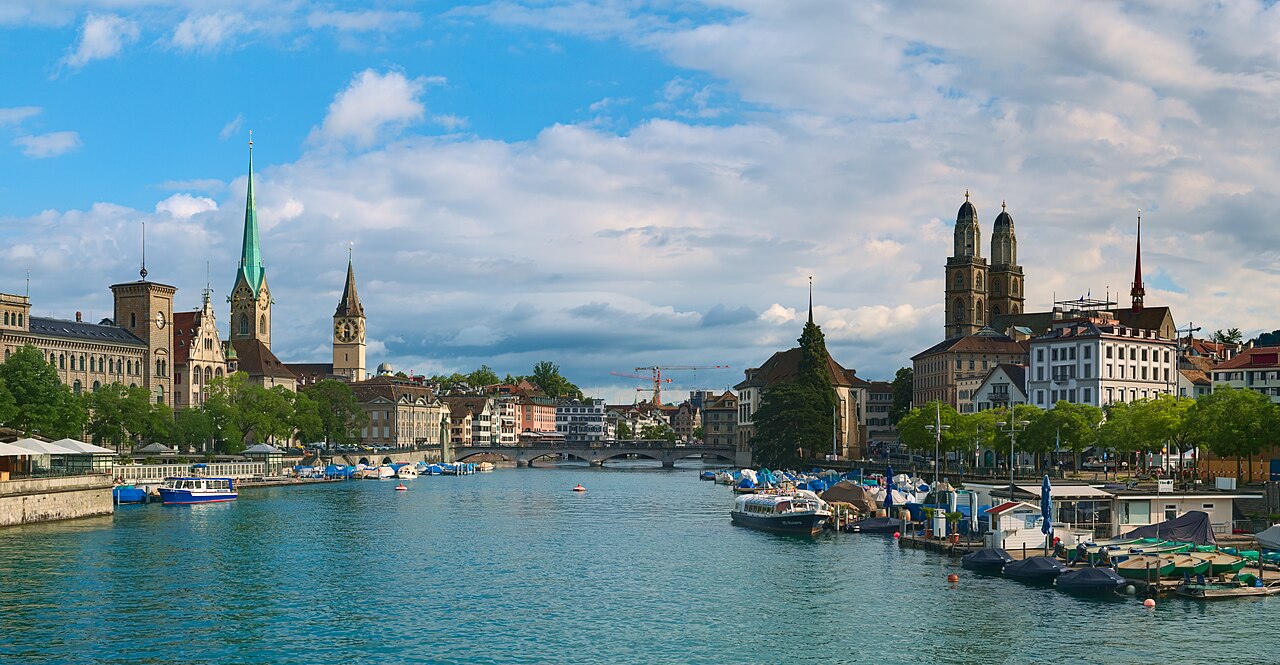
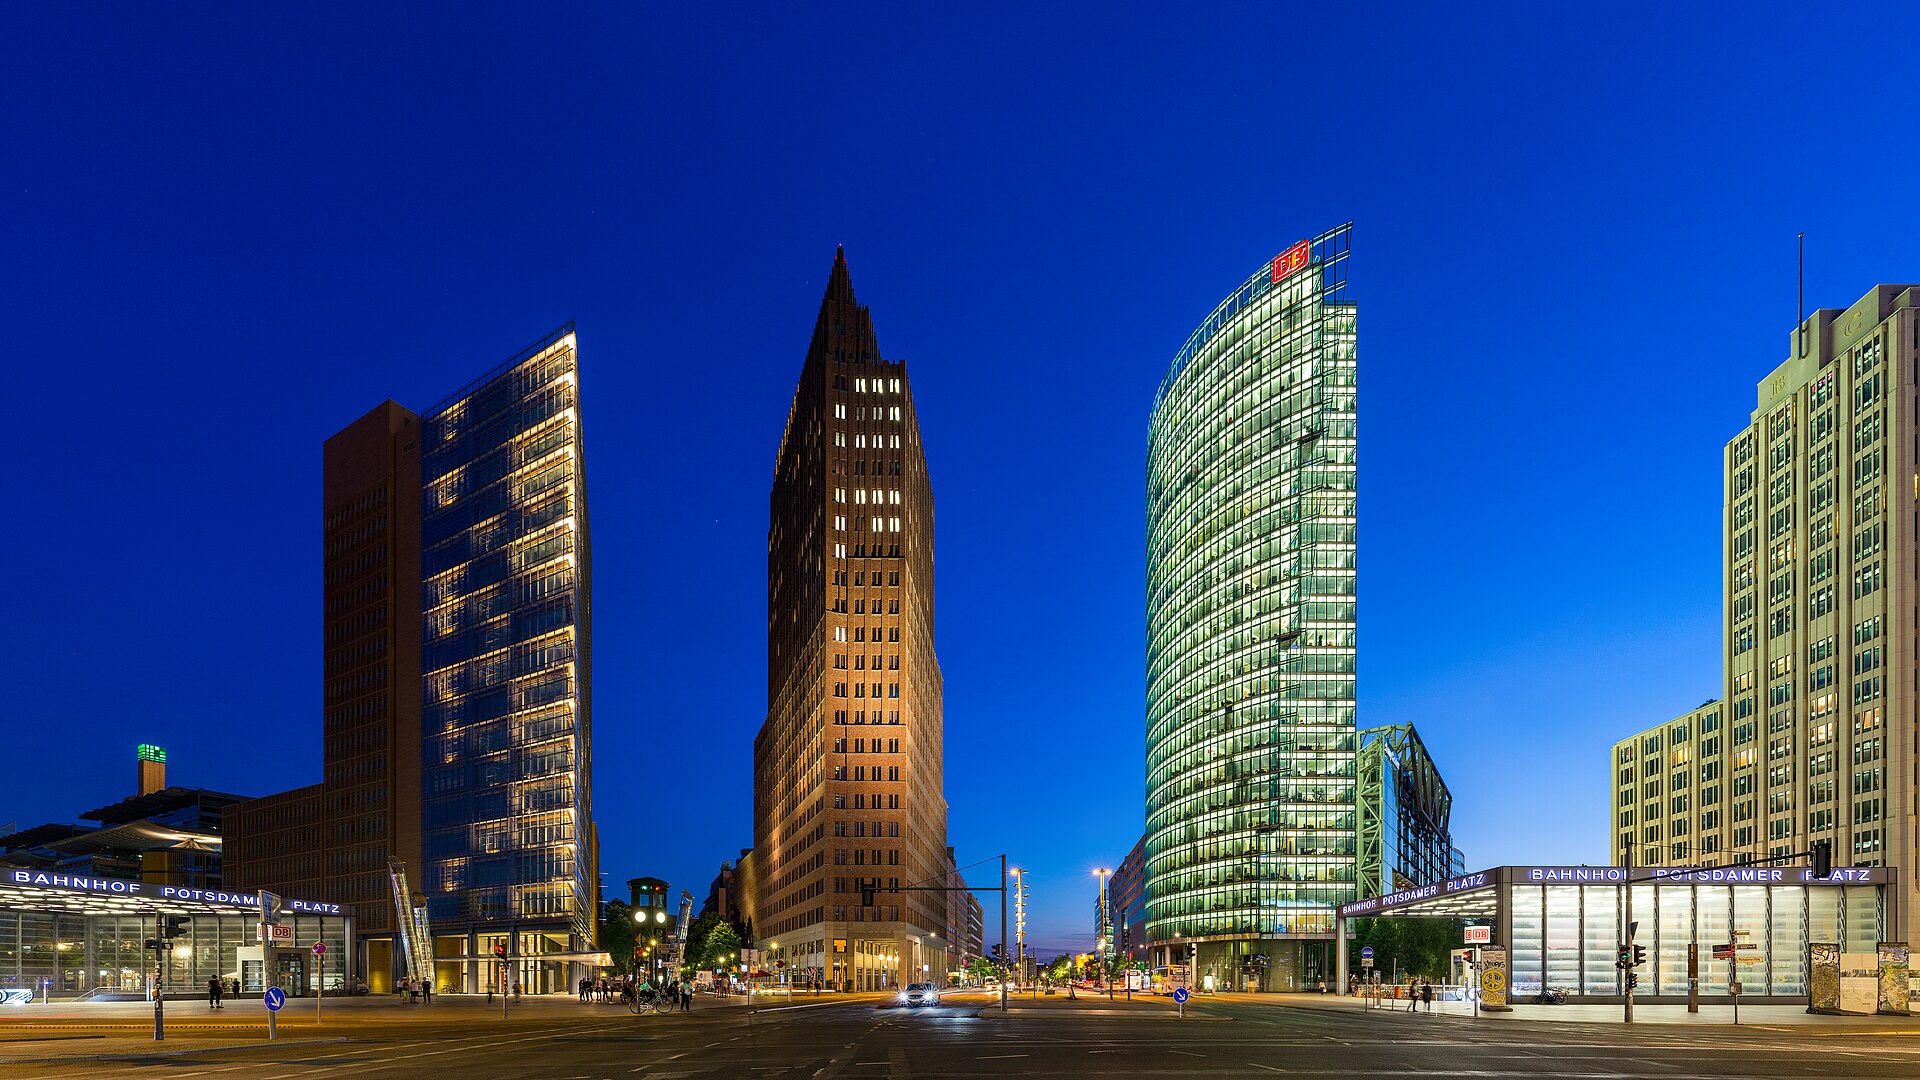
A long map, from New York and Pudong to Lagos and Zurich. Stay with the captions. The page does not end at the first skyline.
Holders
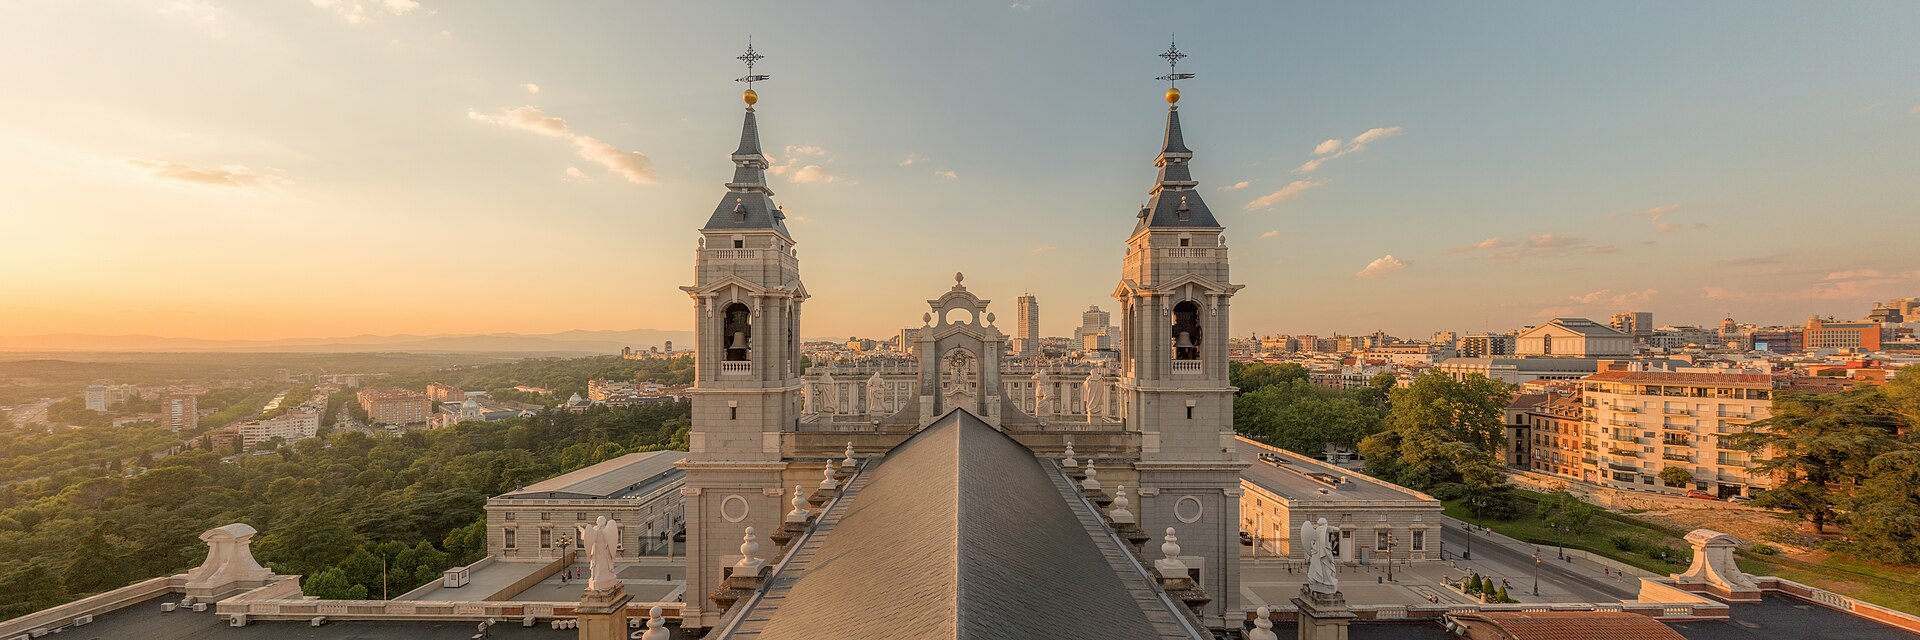
The pyramid, 3,302 billionaires, the debt table, and a long argument about who the average is hiding.
Paths
Move the rate yourself. Then stay for the forces, the years, and the list. The dial is the short part.
Sources
The publications, the method, and a register of every photograph.